 Imagen de Blue Fountain Media bajo licencia CC BY 2.0
Your website is the cornerstone of your business’ online presence. Alongside your website is its helpful sister, social media. Your social media and website presence should be integrated with one another in order to continuously drive traffic to your online assets. And with social media driving traffic to your site, the next step is measuring your efforts so you can improve. As always, this is where Google Analytics comes handy.
Google Analytics provides you with data to see where your website visitors come from and understand your visitors’ behavior on your site. Additionally, when you setup your Google Analytics account to track and measure your social media initiatives, you’ll then be able to adequately prove the ROI of social media for your business.
To get you started, we’ve put together this guide to tracking social media in Google Analytics in 6 easy steps.
Step 1: Create social media objectives and goals for your website
Before you can begin tracking your social media initiatives in Google Analytics you need to create social media objectives and goals. These objectives and goals should be part of your overall social media marketing plan and should be aligned with your broader marketing and business strategy. If your objective is to use social media to increase website traffic, then create S.M.A.R.T. goals that will help you achieve that objective.
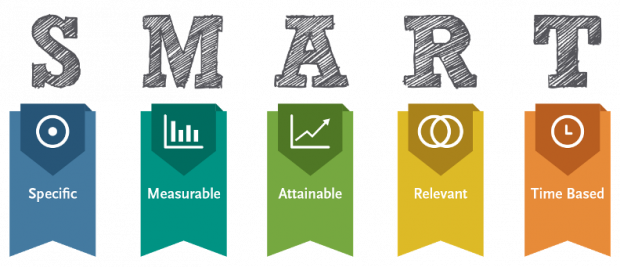
For example: To increase website traffic by 15% in Q2, 100 Tweets a month will be dedicated to driving traffic to the website.
Step 2: Sign up for Google Analytics
This step is extremely important if you want to track social media in Google Analytics. It’s important that you have a Google Analytics account to access your website traffic reports. Create a new Google Analytics account, if you don’t have one. Visit google.com/analytics, click Sign in to Google Analytics or Create an account button on the top right hand corner, and follow the on-screen instructions.

Step 3: Setup your Google Analytics tracking code
In order to gather website data from Google Analytics you need to first setup your tracking code. There are two ways to collect page tracking data: Google Tag Manageror by adding the tracking code directly to your site.
1) Google Tag Manager
This approach is recommended because using Google Tag Manager simplifies tag management on your site. It makes it easier to add other tags, such as AdWords Conversion Tracking and remarketing tags, to your site and configure Google Analytics tracking. Follow the steps in the video below to setup Google Tag Manager.
2) Adding the tracking code directly to your site
In order to do this you first must have access to your website’s source code and be comfortable editing HTML.
To set up the web tracking code:
Sign in to your Google Analytics account, select the Admin tab. From the Account and property columns, select the property you’re working with. Click Tracking Info > Tracking code.
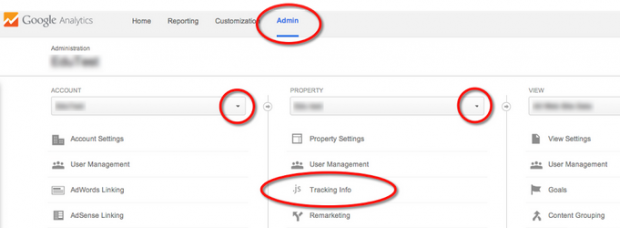
Copy the snippet. It starts with <script> and ends with </script>. Make sure to not reuse the same tracking code snippet on multiple domains.
Paste your snippet into every webpage you want to track, and paste it before the closing </head> tag.
Check your setup to make sure the code shown in Google Analytics is the same that is on your website’s source code.
Step 4: Setup Google Analytics Goals
Tracking the true effectiveness of social media for your business goes beyond pageviews and visits. Finding out if social media actually helps your business is more important if you’re trying to prove the ROI of social media. Knowing important metrics like: product sign ups, leads, downloads, and newsletter signups, will help you solidify the importance of social media for your business.
To create Goals follow these steps by Google Analytics.
Step 5: Understanding Social Analytics Reports
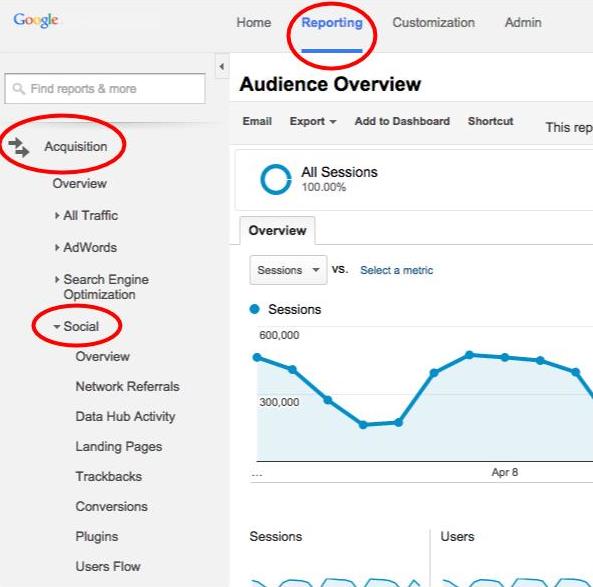
There are 8 Social Analytics reports available in Google Analytics. These reports will help you understand the impact and effectiveness of your social media initiatives. You can find these reports under the Reporting tab > Acquisition > Social.
1) Overview report
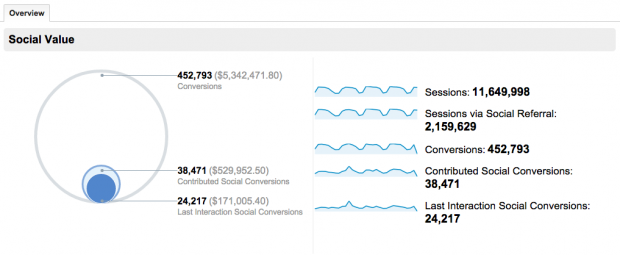
This report allows you to see a glance into how much conversion value is generated from social channels. The social value graph compares the number and monetary value of all goal completions versus those that are from social referrals.
2) Network referrals
This report will provide you with engagement metrics for traffic from each social network. It will show you which social networks referred the highest quality traffic.
3) Data Hub Activity
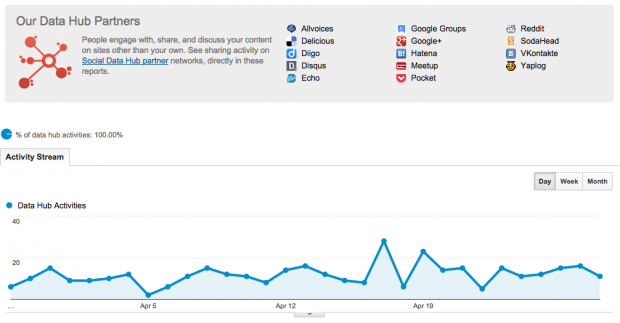
The Data Hub Activity report shows you how people are talking about and engaging with your site content on social networks. You’ll be able to see the most recent URLs people shared, how they shared it, and what they said.
4) Landing pages
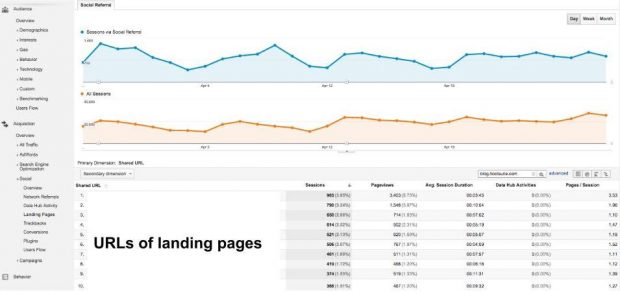
This report allows you to see engagement metrics for each URL. Each URL will show you the originating social networks for that URL.
5) Trackbacks
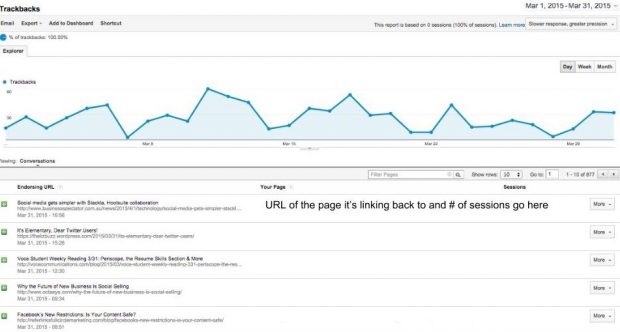
In this report you’ll be able to know which sites are linking to your content, and in which context. You can use this data to replicate successful content and build relationships with those who frequently link to your site.
6) Conversions
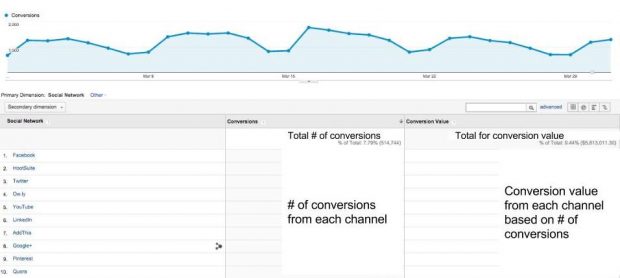
This report is the report where you can really quantify the value of social media for your business. The Conversions report will show the total number of conversions and the monetary value of conversions that occurred as a result of referrals from each network. Note: Step 4 must be completed in order for this report to be populated with data.
7) Plugins
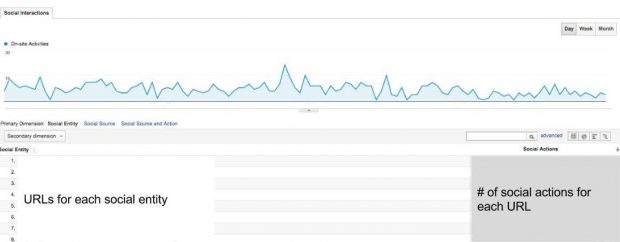
If you have social share buttons on your site it’s important to understand which buttons are being clicked on and for which content. This report provides you with the data necessary to know which articles are most commonly shared, and from which social networks they’re being shared on.
8) Users flow
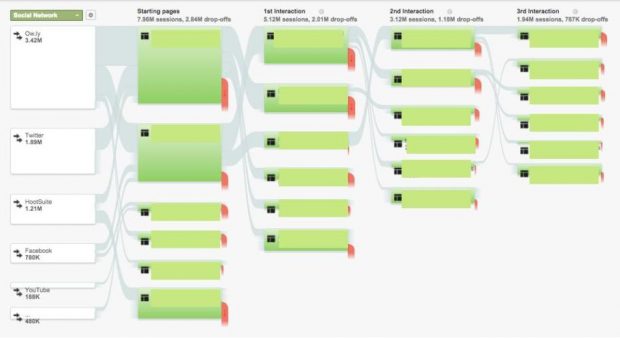
The Users Flow reports shows the initial paths that users from social networks took through your site. If you run campaigns that promote specific products, you can see whether users from each social network entered your site through a product page and whether or not they continued to other parts of your website.
Step 6: Reporting on the data from these reports
Now that you have the data that you need to showcase how your social media initiatives is driving traffic to your website; compile the necessary data and present it to your boss in either a PowerPoint or Google Presentation. Make sure to only include the data that aligns back to the goals you initially created in Step 1. Your presentation should include graphs and 2-3 sentences explaining what each graph means to your business.
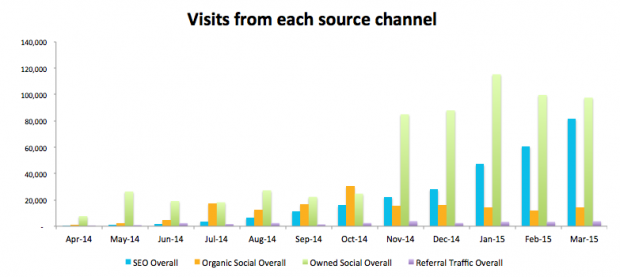
For example, if you want to show how social media is doing in driving traffic to your website you can create a graph that compares it to other source channels, like the graph below, then talk about how owned and organic social channels are driving the most traffic to your website.
We hope this 6 step guide to tracking social media in Google Analytics helps gets you started on the right track to proving social media ROI. Just remember to always be: tracking, measuring, analyzing, and improving, in order to constantly improve your business’s online assets.

