Saturday, December 31, 2016

Social Media KPIs Marketers Can’t Ignore


How do you measure social? If you’re a social media marketer, it’s pretty much guaranteed that your boss has asked you to provide results showcasing your efforts. You might have initially been baffled as to how you would measure values such as awareness, what your customers think of your brand, or how your efforts are impacting the bottom line, but thankfully this is where KPIs, or “key performance indicators,” come to the rescue. In recognizing valuable KPIs, you are able to track not only your successes, but campaigns that perhaps missed the mark.

Key Social Media KPIs to Track


In monitoring and measuring your KPIs, you are able to focus your attention and efforts in order to optimize all of your resources to those most valuable to your organization. However, it can be difficult to know where to start when wanting to zero in on your social media measurement strategy, so to help you know what to look for, we’ve rounded up a list of suggested KPIs you can tailor to suit your business goals.

Social Media Presence


The first area you want to examine and measure is your brand or organization’s social media presence. How prominently does your company appear on social? How many people are talking about your organization, product, or service? These questions can all be answered by taking a look at the following KPIs.

1. Followers and fans


These are the easily measurable numbers of social media users who have subscribed to your account so they can see your content on their feed. Instagram and Twitter see followers, where Facebook business pages will have fans.

2. Number of mentions

A mention is “the act of tagging another user’s handle or account name in a social media message.” In measuring the number of mentions your brand is getting on social media, you are able to not only monitor conversations surrounding your company, but get a good indication of your company’s overall reach.
3. Reach

As our 2015 Social Media Glossary explains, “Reach is a data metric that determines the potential size of audience any given message could reach. It does not mean that that entire audience will see your social media post, but rather tells you the maximum amount of people your post could potentially reach. Reach is determined by a fairly complex calculation, that includes number of followers, shares, and impressions as well as net follower increase over time. Reach should not be confused with Impressions or Engagement.”

4. Inbound links

This is in reference to the number of links back to your blog or website you are getting from quality references. As Vital explains, “Link building should be a cornerstone of your SEO strategy. When someone links to your website it means you’re building your street cred within your given industry.” Hubspot echoes these sentiments, explaining that marketers must “keep track of your average inbound links so you can keep tabs on the quality of your content (more important than ever in the eyes of Google) and thus, your inbound links’ impact on your search authority.”

5. Blog subscribers

As a key component of your content marketing strategy that goes hand in hand with your social media efforts, your brand’s blog offers a great way to track overall success. As Hubspot describes, “There’s a direct correlation between the number of email subscribers you have and the amount of email traffic you generate to your blog. If you haven’t put a lot of effort into generating email subscribers, you’re sitting on a gold mine of opportunity.”
Social Media Engagement

While numbers reflecting your social media presence are valuable, knowing how engaged your audience actually is usually says a lot more about the success of your social media campaign. The following KPIs offer insight into your engagement levels and will also reveal areas where you could possibly improve.

6. Retweets

Retweets are “your Tweets forwarded by people who follow you to their own network of followers. This gives you the opportunity to reach more people who may think your content is valuable. That new network of Twitter users who are exposed to your Tweets have the potential to become a part of your primary network if they come back and follow you.”

7. Social shares
Like retweets, shares “take your content to the next level by spreading it across networks that you are not directly connected to. This allows you to increase social media engagement and brand awareness.”

8. Comments

While pretty self-explanatory, comments are messages and feedback left by other users, and a great way of tracking your audience’s general sentiment and feedback.

9. Referral traffic

Measuring referral traffic is a way of monitoring the amount of traffic going to your website or blog from your social media channels.

Social Media Reach and Influence

If a social media post doesn’t get a single like, does it still exist? Your message could be the most beautifully crafted piece of content on the face of the planet, but if nobody’s there to witness or engage with it, you are missing out on great opportunities for growth and reach. The following important KPIs will help you measure these areas, and ensure that your content doesn’t go unnoticed.

10. Share of voice

Share of voice is a metric for understanding how many social media mentions a particular brand is receiving in relation to its competition. Usually measured as a percentage of total mentions within an industry or among a defined group of competitors.”

11. Net promoter

As our 2015 Social Media Glossary explains, “A customer loyalty metric that is based on the following question: “On a scale of zero to 10, how likely is it that you would recommend our company, product, or service to a friend or colleague?” People who respond with a nine or 10 are designated as “promoters”; a seven or eight as “passives”; and a six or lower as “detractors”. The percentage of customers that are detractors is then subtracted from the percentage that are promoters to arrive at the company’s NPS.”
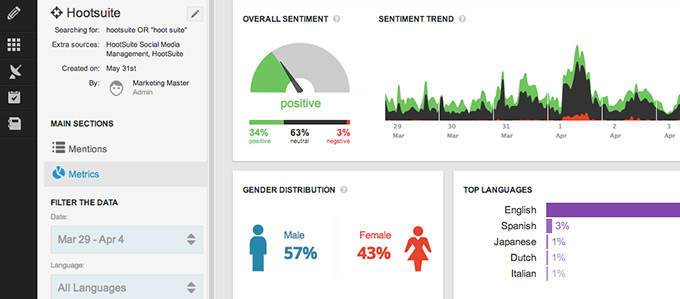
12. Sentiment

“An attempt to understand how an audience feels about a brand, company, or product based on data collected from social media. It typically involves the use of natural language processing or another computational method to identify the attitude contained in a social media message. Different analytics platforms classify sentiment in a variety of ways; for example, some use ‘polar’ classification (positive or negative sentiment), while others sort messages by emotion or tone (Contentment/Gratitude, Fear/Uneasiness, etc).”

13. Number of social influencers


With a social media influencer being “a user who can reach a significant audience and drive awareness about a trend, topic, company, or product,” the number of influencers your brand has working with you is a good indicator of popularity and overall success. If people want to work with you and represent your product or service, there’s a good chance you’re doing something right.

14. Post reach

This is the number of users who see a specific social media post.
15. Potential reach

As defined by Facebook, potential reach is those who “match the audience you defined through your audience targeting selections.”

16. Video views


Thanks to the inherent qualities in many video hosting platforms, video views are an easy-to-measure KPI and usually can be seen and monitored by anyone. However, as Rocky Walls at Convince and Convert explains, “If you have a CTA in your video and its purpose extends past a viewer simply watching the video, then judging the successfulness of the video should involve more than simply checking the number of views you have.”

Action and ROI

Once your content is out there, it’s important to measure whether your social media efforts are resulting in your desired outcomes. What are the actions you want your audience to complete, upon seeing your message? What are your business goals and objectives? While having users see your message in the first place is half the battle, it’s imperative that you’re seeing tangible results from your strategy. These KPIs offer ways to measure whether your messages are making their mark.

17. Conversions

As our Social Media Glossary defines, “In social media marketing, a conversion is a positive action that is taken on a website by a visitor from social media. The action demonstrates that the visitor is “converting” into a customer. Sales aren’t the only type of conversion; many websites measure webinar registrations, newsletter signups, content downloads, and other important outcomes that ultimately lead to a sale. Tracking conversions is crucial to properly attributing revenue to social media.”

18. Sales revenue

It’s probably safe to say that one of your business objectives is to increase revenue, and it goes without saying that sales revenue is the way to measure this. It’s important to know how your social media efforts are affecting your bottom line, and sales revenue is a way to pinpoint this. Dylan Kissane at Doz suggests, “When you close a sale, find out how the customer found out about you: a TV commercial, a Facebook interaction, word of mouth, or some other way.”

19. Issues resolved


If one of your business objectives is to improve customer service through social media, a great way to measure the progress here is through the number of issues your organization resolves. As Visually explains, “More people are turning to social media channels for issue resolution than ever before. In fact, 72 percent of customers expect complaints made on Twitter to be answered in an hour. Collect data on how people come to you for help or troubleshooting to make sure the busiest channels are monitored and staffed appropriately.”

20. Cost per lead

With your business depending heavily on leads, it’s important to know how much each one is costing you. Klipfolio provides a thorough definition of the term, explaining that “the purpose of this metric is to provide your marketing team with a tangible dollar figure so they understand how much money is appropriate to spend on acquiring new leads.”

21. Lead conversion rate


Once your business has the leads, the natural focus is to turn these leads into actual customers. The lead conversion rate measures the number of leads who actually convert to executing the action you desired of them. Kissmetrics offers a great guide to optimal lead conversion , including the easiest way to track this metric in Google Analytics.

22. Customer lifetime value

Earning the trust and loyalty of customers can be one of the trickiest things for an organization to conquer. It also seems like perhaps one of the more difficult KPIs to measure. However, it’s important when evaluating your business to have a general idea of the revenue a customer will generate for your business in their lifetime. , Kissmetrics has an article that explains how to do calculate your customer lifetime value (CLV) in the simplest way possible.

Internal KPIs

While it may be tempting to concentrate on the KPIs determined by your customers and audience, your organization’s internal measurement tactics are just as important. Recognizing the output of your employees and business overall makes it easier to leverage your resources and keep track of where time and energy is being devoted. In having an overall perspective of what your content team is producing, you have a much better chance of streamlining the process and offering your audience both quality and consistency.

23. Blog posts

If a blog is a part of your content strategy, take a look at how many blog posts you or your team is producing per week. It’s important to take into account how many hours go into the creation of a single blog post, and how many of these your brand is posting per week. What are the returns being seen on each blog post? Consider all of these factors when determining whether your team is concentrating on the most effective strategies.

24. Videos


With video the social media trend to watch in 2016, and with “the number of video posts per person increasing 75 percent globally and 94 percent in the U.S,” it’s a smart idea to dedicate time and resources to making video a top priority in your social media strategy. However, the creation and editing of video can easily become a timely endeavor, so it’s especially important to track how many hours your team is dedicating to this. How many videos are you sharing through your social media channels per day? Is the ROI worth it?

25. Social media posts

The number of social media posts your brand is posting per day is probably one of your key internal KPIs. You want to keep this consistent so that you remain top of mind for your audience, but you definitely don’t want to overwhelm them with a barrage of constant posts. Finding the best number of posts for your organization may take some trial and error, but through keeping track of what works, and what doesn’t, you will quickly find a number that works for you.

26. Social media budget

This is probably one of the KPIs most important to your manager. You will obviously want to set goals and keep a close eye on how much budget you are setting aside for social media. If you find that you are spending more than you or your boss would like, our blog post on how to decrease your social media budget can provide some guidance.

Tuesday, December 27, 2016

Social Data Simple Techniques Anyone Can Master


Social media data can help us better understand our customers—so why don’t we use more of it?
Everyone has heard about big data and how rockstar companies like Amazon and eBay use data to better target customers.
But for most companies, this level of sophistication remains out of reach.
As many marketers know, it’s really hard to find insights. “Everybody talks about big data,” says Scott Monty, executive vice president of strategy at SHIFT Communications and Ford Motors’ former global digital and multimedia communications manager. “But what most companies need at this point are small insights.”
Last week, I published a workshop with simple ways to use social media data to uncover your customer’s hidden motivations.
These are techniques anyone can use. You don’t need to be a data analyst or an Excel pro.
The workshop shows you how to:
  • Better understand your customers by using social data to paint a human picture of your prospect.
  • Create ads and landing pages that resonate by adding actual customer language into campaign messaging.
  • Increase traffic and sales—with social content that has the right level of complexity for readers, viewers, and fans.
I’ve included the written version of the presentation below.

How to use social data to better understand your customer’s frustrations

james-dog
In this post, I’ll use a fictional dog training company to illustrate these techniques. This gives us a lot of data to analyze (people love talking about dogs online) AND gives me a chance to sneak a picture of my dog Watson into a blog post (finally!).
So let’s say you work at a large company that sells dog training products.
You have a new dog training video course that you plan to sell on social media.
But right now, your landing pages, social ads, and content are not connecting with dog owners.
How could social media data help you better understand customers and craft more compelling marketing messages?

1. Use these techniques to find humans, not spam

A key challenge with social media data is the volume of spam and sales messages on social channels.
Search phrases such as “dog training tips” or “train dog to sit” will turn up endless links to product pages, ad campaigns, sponsored content, and spam accounts.
So how can you find conversations between real customers?
I’ve found these three techniques to be helpful.

Avoid SEO keywords—instead use simple, human sentences

In my experience, noun-based SEO keywords are magnets for spam, making it hard to find genuine insights.
When searching in Google, people have been trained to formulate their problems as nouns and short phrases. “I need to train my dog to sit” becomes “dog training tips” or “basic dog training.”
But people don’t complain or talk with their friends like this on social media. Invert these noun-based keywords into simple sentences.
For example, convert “train dog to sit” into “my dog won’t sit.” That’s how a real person would talk about that problem on social media.
I used Hootsuite Analytics to test the impact of inverting SEO nouns into simple sentences.
As you can see in the preview, this type of SEO phrase—a short keyword focused phrase—returns spam, marketing messages, and products.
Those are not the results you want. Zero insights. All noise.
Watch what happens when you invert this SEO noun-based phrase into a simple human sentence. I used Hootsuite Analytics again.
As you can see, I’ve now found real dog owners with Hootsuite Analytics. This is the data you want. Real human conversations.

Find humans with -filter: links

This is one of my favorite Hootsuite search techniques. It helps you eliminate spam and sales messages.
Go to Hootsuite.com. Click “Add Stream.” Click “Search.” Use -filter:links to filter out posts with links as they are often promotional
Example: coffee -filter:links
As you can see below, this filter reveals real humans talking about their day. You won’t have to wade through links, branded content, or promotional posts.
Filter.gif

Look for F-Bombs in your social media data

Look through your results. Is it clean and professional language? You are likely looking at vendor and brand results.
Refine your searches until you find actual humans talking (and often swearing) about products and services. Humans write with horrible grammar, swear, and say offensive things.
If you are finding offensive language, you are on the right path.

2. Pinpoint customer frustrations with product reviews

One of the best ways to get inside the minds of customers is to read product reviews. By using this search operator—!Amazon + Your Keyword— in DuckDuckGo you can tap into Amazon’s rich search engine. It also works for eBay and YouTube.
Go to DuckDuckGo and enter this search: !Amazon + Keyword.
Duck Duck Go 600PX.jpg
Example: !Amazon + dog training or !eBay + dog training.
Now, you can quickly read product reviews and swipe real customer language to use in Tweets, emails, landing pages, and blog posts.
A quick review of Amazon reviews for “dog training” shows that people wished one popular book had more specific steps rather than abstract theory.
Screen Shot 2015-11-24 at 12.49.10 PM.png
Mirror this customer language on landing pages and social content—for example, you could talk about how most dog training products focus too much on theory, rather than giving specific ways to leash train and other step-by-step instructions for new dog owners.

3. Reddit is a goldmine for consumer insights

I find Reddit is incredibly useful for uncovering true conversations about brands and products. Companies and spam accounts are kicked out the front door if they try to game the community with fake discussions.
You can track conversations with the Reddit Keyword Monitor Pro app for Hootsuite. That way, you can monitor for new content and follow customer conversations without leaving your Hootsuite dashboard.
Screen Shot 2015-11-24 at 1.35.58 PM.png

4. Book time in your calendar to listen

Once you’ve found the phrases and topics you want to monitor, build a listening dashboard. I recommend booking an hour in your calendar every week to observe customers in their natural habitat. What are they sharing? What do they love or hate? What’s their daily life like?
There’re lots of different ways to build a listening dashboard.
You can use a solution such as Hootsuite Analytics. Or manually pull mentions and data into a spreadsheet.
ubervu-keyadvantages

I also have my Hootsuite dashboard configured with search streams for different terms and customer social profiles.
Here’s how to build a listening dashboard for your customer personas.
  • Make a list of 10-15 social media users that represent your ideal customer. These are real people that you follow and study on social media.
  • Create search streams in Hootsuite to easily monitor and learn from these ideal customers. Add them to a list in Hootsuite.
  • Use a solution such as Hootsuite Analytics to conduct deep social media listening, pulling in broad data about your market and phrases (such as “my dog won’t sit”).
  • Book time every week to listen to your market and understand their daily struggles.

5. Add your new insights to your marketing plan

Once you’ve begun to listen, refine your marketing strategy based on this new data.
  • Make sure landing pages and ad copy mirror the language and challenges you’ve pulled directly from real customers.
  • Find new ways to position your products, using customer-centric language instead of product features and marketing jargon.
  • Build blog posts and social content that solve customer questions you’ve found on social networks.
It’s also important to add your new insights to your customer persona documents. For example, here’s what I would create.

Our ideal customer: Sarah

  • Sarah’s buying trigger is dog behavioral problems.
  • Common phrases used “my dog won’t sit next to me,” “my dog won’t cuddle,” “my dog doesn’t like me anymore.”
  • How to position: don’t focus on tricks. Instead, focus on training as a way to restore her damaged relationship with her dog.
  • Twitter is a common place where dog owners complain (invest in Twitter ads?)
  • Reddit is a popular place where owners seem to go to ask peers for advice. Could we partner with a famous dog trainer to do a Reddit AMA (ask me anything) about dog training? We could co-brand our product with the influencer so that the promotion fits into Reddit’s strict community policies.

More simple ways to use social media data

In our Social Media Data Cookbook, you’ll find more simple ways to use social media data. The SEO cluster recipe for increasing website traffic is one of my favorites.
The Cookbook shows you:
  • The No. 1 persuasive way to prove impact of your social media campaigns
  • A simple test you can run to see the exact ROI of social messages
  • Dead-practical ways to discover what your customers want
  • Why conversation clusters and social media data boost SEO traffic
  • How SXSW uses social media data to measure the success of live events
  • Extra videos, bonus resources, and step-by-step instructions

How Hootsuite’s social media analytics help

With Hootsuite, your team can analyze social conversations happening on news sites, blogs, forums, and other public places.
  • Discover customers talking about your brand, industry, and competition right now
  • Analyze social conversations around your products from 100+ million data sources in 50+ languages
  • Build live dashboards to easily monitor market terms and customer conversations about your products and competitors

Snapchat Demographics That Matter to Social Media Marketers


Snapchat may not be as familiar to marketers as Facebook and Instagram, but its dedicated user base can’t be ignored. Think about these two facts for a moment: The entire population of the world is 7.4 billion people. Snapchatters watch more than 10 billion videos every day. (That’s way up from the 2 billion per day they watched in May 2015.)
Of course, the entire world is not using Snapchat—yet—but more than 100 million people do use it every day (spending an average of 30 minutes a day inside the app), and there are 200 million active users worldwide. And Snapchat’s user numbers are still growing fast: eMarketer forecasts that by the end of this year, Snapchat will have a larger user base in the U.S. than either Twitter or Pinterest.
With all those people posting all that content, it’s important for marketers to get a sense of the most important Snapchat demographics segments so they can plan a marketing strategy that maximizes the app’s unique characteristics, rather than just getting lost in the noise.
With that in mind, we’ve pulled together the key details social media marketers need to know before they start Snapping.
Bonus: Download a free guide that reveals how to easily create and use a custom Snapchat geofilter to promote your business for as little as $5.

Snapchat age demographics

Data from the Statistics Portal backs up the common assumption that Snapchat is still dominated by the young: 60 percent of users are under 25, and nearly a quarter (23 percent) have not yet graduated from high school.
By far the largest Snapchat age demographic is 18- to 24-year-olds. This age group makes up 37 percent of Snapchat users. But well-past-college-aged 25- to 34-year olds make up about 26 percent of Snapchatters, and about 12 percent of users are aged 35 to 54.
Still, Snapchat is not currently a player in the Baby Boomer market: Only two percent of users are over 55.
Apart from how each age group is represented in the Snapchat universe, though, it’s worth looking at Snapchat’s penetration rate in each age category, since these numbers can tell a different story, especially since penetration in the older demographics is growing fast—more than half of new users signing up to Snapchat are over the age of 25.
Three years ago, hardly anyone over age 25 was using the app—just five percent of smartphone users aged 25 to 34 and a tiny two percent of those over 35. But today, well over a third (38 percent) of 25- to 34-year-old smartphone users and 14 percent of smartphone users over the age of 35 use Snapchat. They’re gaining fast on the 18 to 24 group, for which Snapchat’s penetration rate is 69 percent.
According to Snapchat’s own figures, on any given day, 41 percent of 18- to 34-year-olds use the app.
Marketers should keep an eye on changes to Snapchat age demographics and be flexible when planning a longer-term strategy. Variety reported that almost a third of the 13- to 24-year-old Snapchatters they surveyed said they used Snapchat specifically because their parents did not. As more parents start to use the app, marketers need to keep an eye on how the younger user base responds.
Targeting that large 18- to 24-year-old demographic and the growing population of slightly older users, FOX used a Snapchat sponsored lens to drum up excitement for its midseason Empire premiere. Superimposing Snapchatters with a pair of gold headphones, sunglasses, and a microphone, the lens also prominently displayed information about the show’s airtime. The campaign reached 27 million Snapchatters, who spent an average of 20 seconds playing with the Empire lens, creating a 16-point increase in brand awareness and an eight-point increase in tune-in intent. Empire was the most-watched show on its premiere night, and took top spot for the 18- to 49-year-old demographic coveted by TV advertisers.

Snapchat gender demographics

Snapchat does not publish gender information for its users, and reliable Snapchat gender demographics data can be hard to come by. But unless things have drastically changed in the last three years, you can bet most Snapchatters are women and girls. The Wall Street Journal reported in 2013 that roughly 70 percent of Snapchat users at that time were women, a figure that came from Snapchat co-founder and CEO Evan Spiegel himself.
Harvard survey from fall 2015 confirmed that a significantly higher percentage of women use Snapchat than men, with 42 percent of the female 18- to 29-year-olds surveyed saying they had a Snapchat account, compared to 31 percent of male respondents. That survey also showed Snapchat was the fastest growing social network among all respondents, so those numbers have likely increased in the last year.
That high usage among young female users made Snapchat a natural fit when bareMinerals launched its Blemish Remedy acne product. With a campaign dubbed “Zit Happens,” the makeup company created a how-to Snapchat video showing girls how to hide their pimples. Thirty percent of the 1.9 million Snapchatters who saw the videos swiped up to learn more and spent an average of 30 seconds learning about the product. bareMinerals saw the search traffic for the Blemish Remedy product on its website double after the campaign.
Top Snapchat Demographics That Matter to Social Media Marketers | Hootsuite Blog
Image of bareMinerals Snapchat ad via Snapchat.

Snapchat location demographics

Snapchat has its highest penetration rate in Ireland, followed by Saudi Arabia and Sweden, according to the Global Web Index, with India, the United States, the United Arab Emirates, Canada, Belgium, the United Kingdom, and France rounding out the top 10.
The Global Web Index figures, which are based on internet users aged 16 to 64, show that Ireland has a Snapchat penetration rate of nearly 20 percent, compared to about 10 percent in the United States.
If those numbers seem low, it’s because they include users up to age 64 (remember that only two percent of Snapchat users are over 55), and because they include users who only access the internet from a computer—putting the mobile-only Snapchat out of reach.
Back in 2013, AllThingsD reported that 25 percent of smartphone users in the United Kingdom used Snapchat, along with 50 percent of smartphone users in Norway, based on numbers from Snapchat’s Evan Spiegel.
With that diversified global reach, Snapchat is a good platform for campaigns with a global message, like (RED)’s global one-day-only Geofilters marking World AIDS Day. For each use of a Geofilter, the Bill & Melinda Gates Foundation donated $3 to (RED) for its work in the fight against AIDS.
The campaign reached 14 million Snapchatters and had 76 million total views worldwide—and those who saw the filter were 90 percent more likely to donate to (RED), even apart from the money raised by sharing the Geofilter itself.
This summer, (RED) launched another unique global campaign with The (RED) Kitchen Snapchat cooking show, in which celebrity chefs shared bite-sized cooking lessons with Snapchatters around the world as part of the Eat (RED) Save Lives initiative.

Other Snapchat demographics

The fall 2015 Harvard survey of young (18 to 29) Americans reveals a few more interesting Snapchat demographics that marketers should take note of:
  • College students are more likely to have Snapchat accounts: 53 percent of college students surveyed said they had a Snapchat account, compared to 46 percent of all 18- to 24-year-olds.
  • Snapchat users have no particular political affiliation: 39 percent of Democrats, 37 percent of Republicans, and 35 percent of independent voters said they had Snapchat accounts.
  • 40 percent of young Snapchat users identified as White, 25 percent identified as Black, and 34 percent identified as Hispanic.

Snapchat demographics takeaways

Snapchat users are young, female, and well distributed throughout Europe, North America, Asia, and the Middle East. While Snapchat use among adults up to age 55 is growing fast, Baby Boomers are still a tiny fraction of the Snapchat user base.
As Snapchat demographics start to shift, it will be interesting to see if the young people who currently love Snapchat as the social network their parents haven’t discovered yet continue their love affair with the app. For now, they’re highly engaged, posting like crazy, and willing to interact with brand content that speaks to them.
Now that you understand who’s using Snapchat, you can start using Snapchat for businessdevelop a Snapchat strategy to target your brand’s key demographic, discover some Snapchat hacks to make your Snaps stand out from the crowd, and learn how to craft the perfect Snapchat Story.
Hootsuite’s on Snapchat! Click this link on mobile to go directly to Hootsuite’s profile or scan the Snapcode below to add Hootsuite as a Friend on Snapchat.
hootsuite-snapchat-snapcode
Filed Under:
  • Strategy 
  •  
  • Resources