If you’re like me, you skipped, slept, and talked through every high school math class. Years later, you have to explain things like “we gave you $50,000 to spend on Facebook ads—what’s the return on investment [ROI]?” or “what’s our average growth rate for website traffic this quarter?”
Thankfully, the internet has given us a lot of tools and ROI calculators. Tools are helpful—but it’s embarrassing if you don’t really know the simple math behind ROI calculations. And if a spreadsheet breaks or tool gives you an error, you have no way of double-checking a report before sending it to your boss.
Use these four ROI formulas to better prove and analyze the ROI of your social media and digital channels. I’ve also included links to further resources, so that you become a master of these simple and powerful ways to calculate your ROI.
4 ROI formulas to prove the value of social media and impress your boss
1. How to measure your (true) ROI
Marketers make a common mistake when calculating ROI. They use gross profit, forgetting to include the cost of goods sold.
For example, let’s say you spend $100 on Instagram ads and sell 10 products at $25.
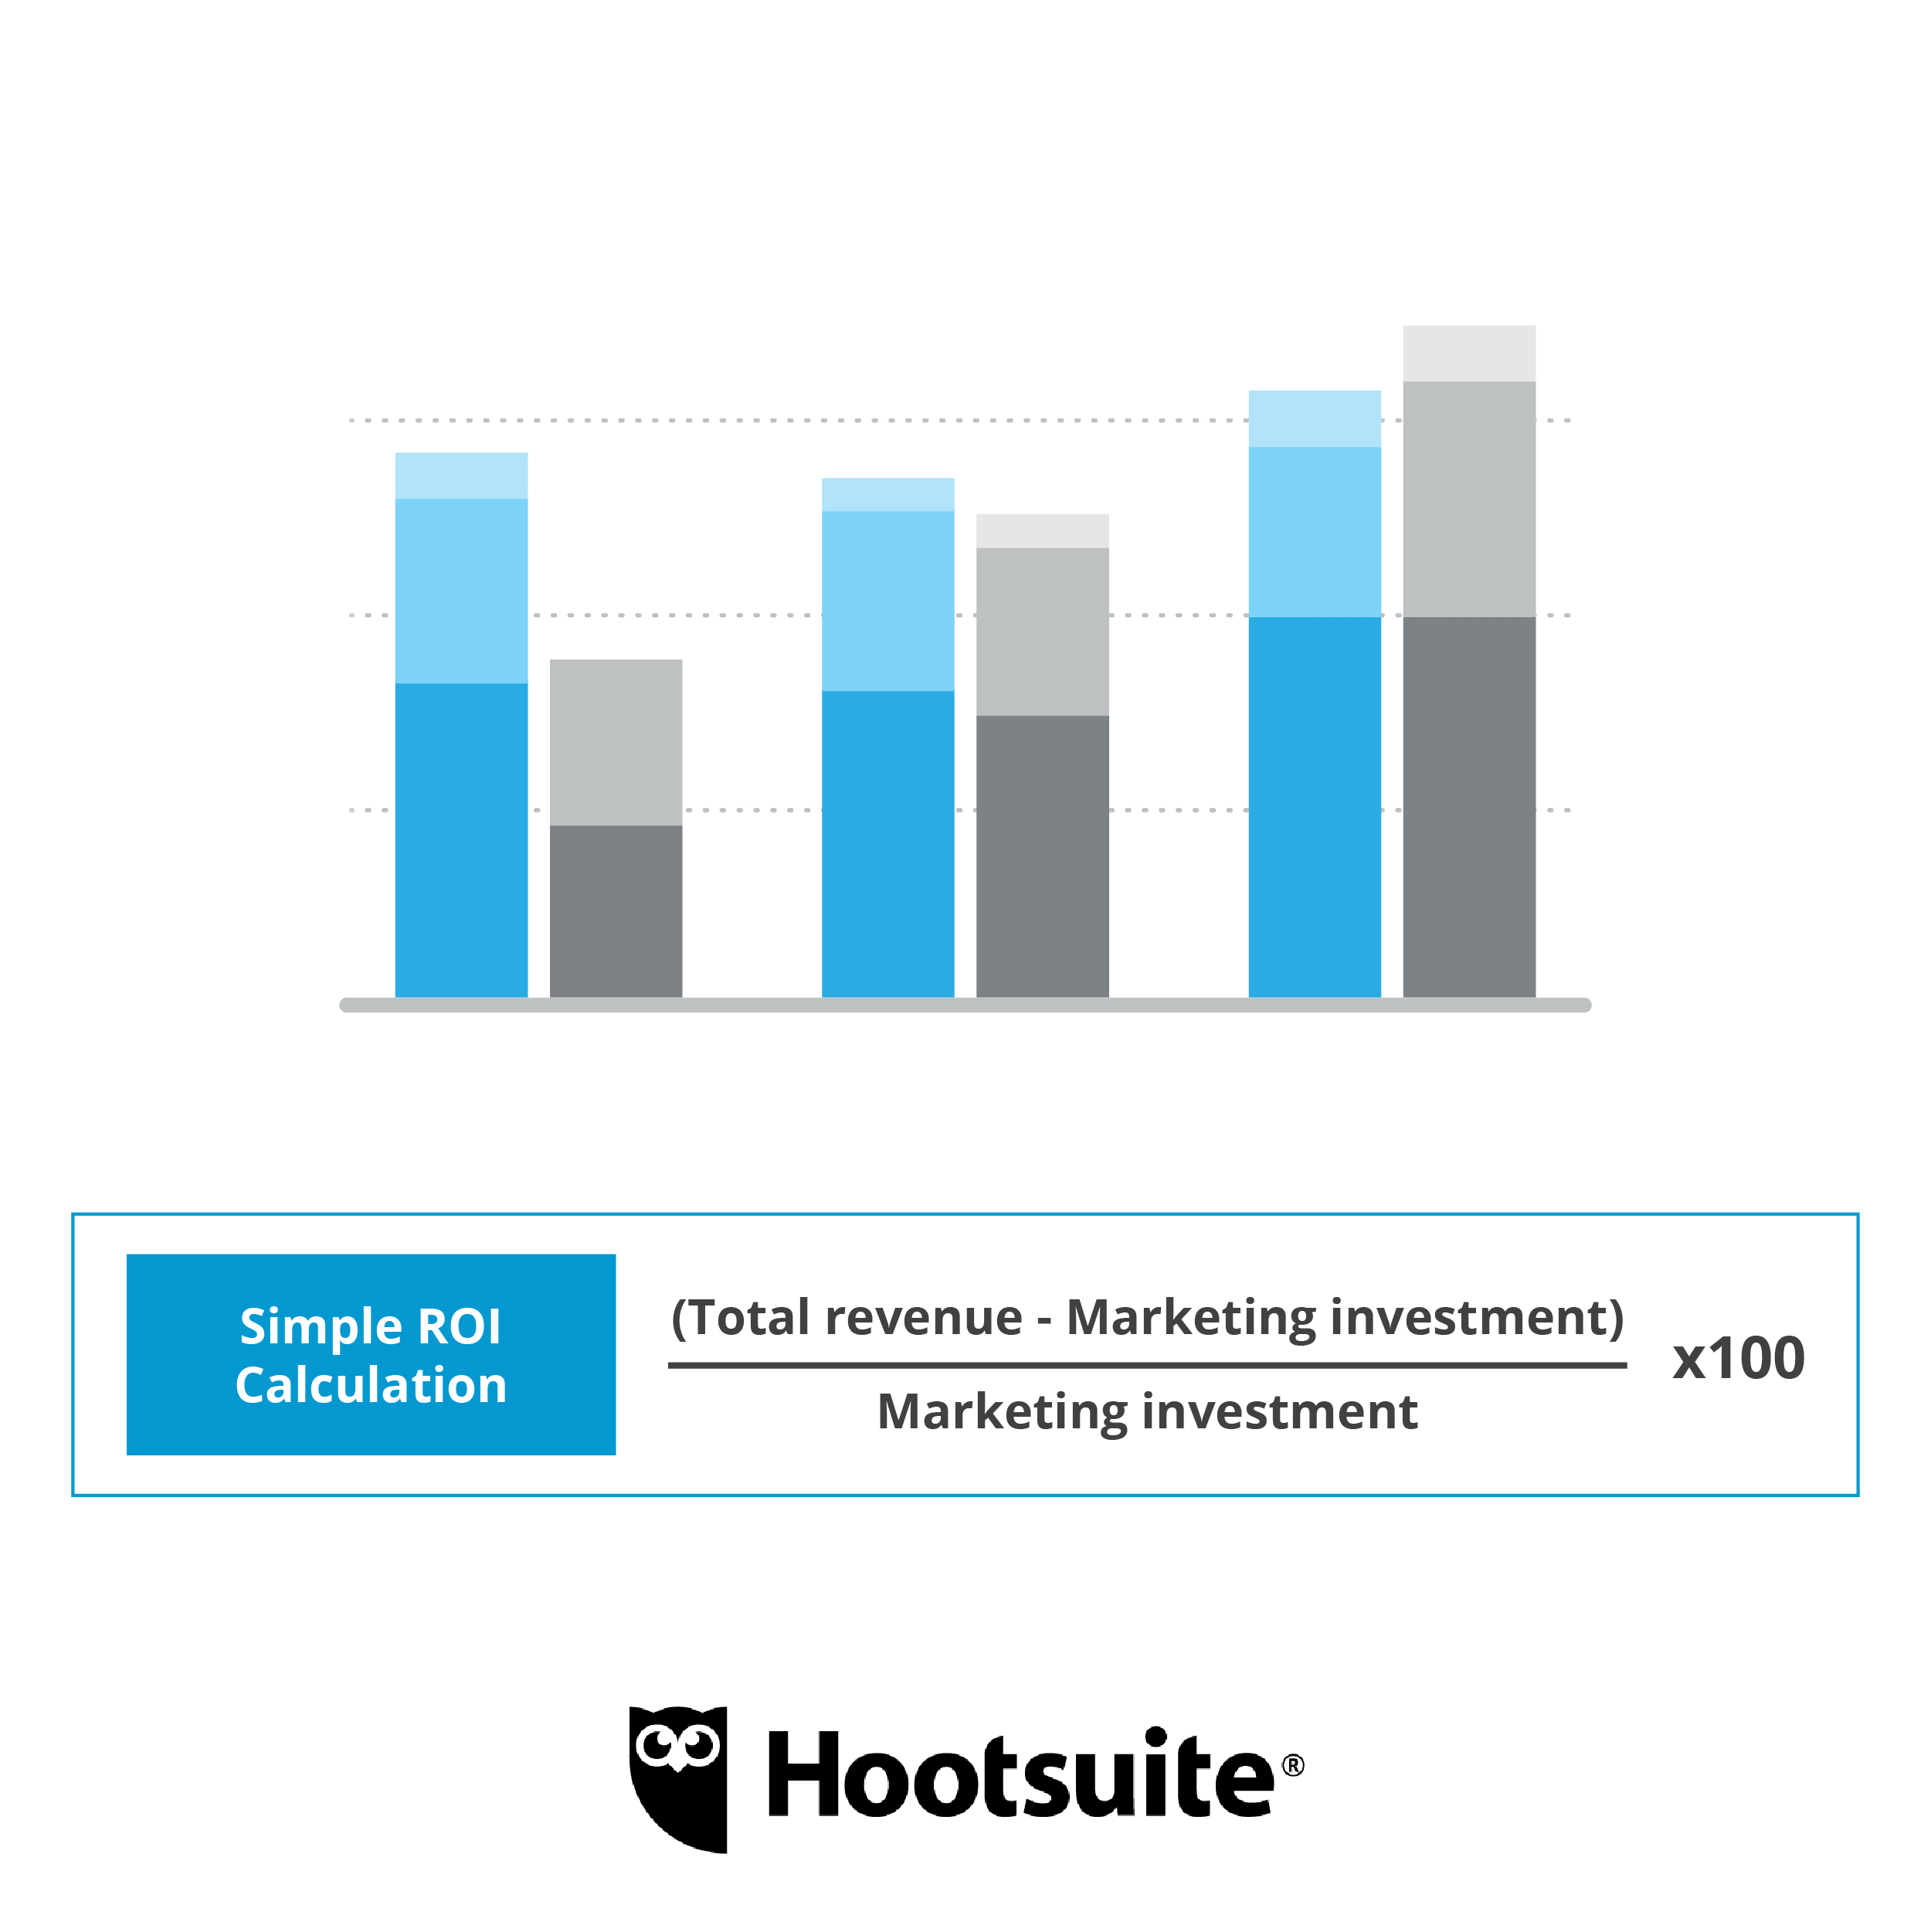 Click image to view and download larger file.
In the calculation above, total revenue would be $250 (10 x $25). We spent $100 on Instagram ads. Subtract our gross sales ($250) by our marketing investment ($100). The answer is 150. Divide this number by our marketing investment (100). The answer is 1.5. Multiply 1.5 by 100. The answer is 150.
According to this basic calculation, our ROI would be 150 percent, an impressive return. (I realize I took the long mathematical route to get here but didn’t want to lose you when I introduce another variable in the next calculation.)
This is an easy way to calculate ROI. But it’s not very accurate as it only uses gross sales instead of accounting for our profit margin. A CFO would laugh us out of their office, yelling “Math shame! Math shame! Math shame!”
As the marketing company Qlutch explains, “You have to consider what it costs to produce whatever it is that you’re selling and subtract that cost from your gross revenue. It’s a good idea to calculate your marketing ROI based on your gross profit for the product or service you’re selling, not on your gross revenue.”
Here’s a better (though slightly more complicated) way to calculate your ROI.
How to calculate ROI with cost of goods sold (COGS)
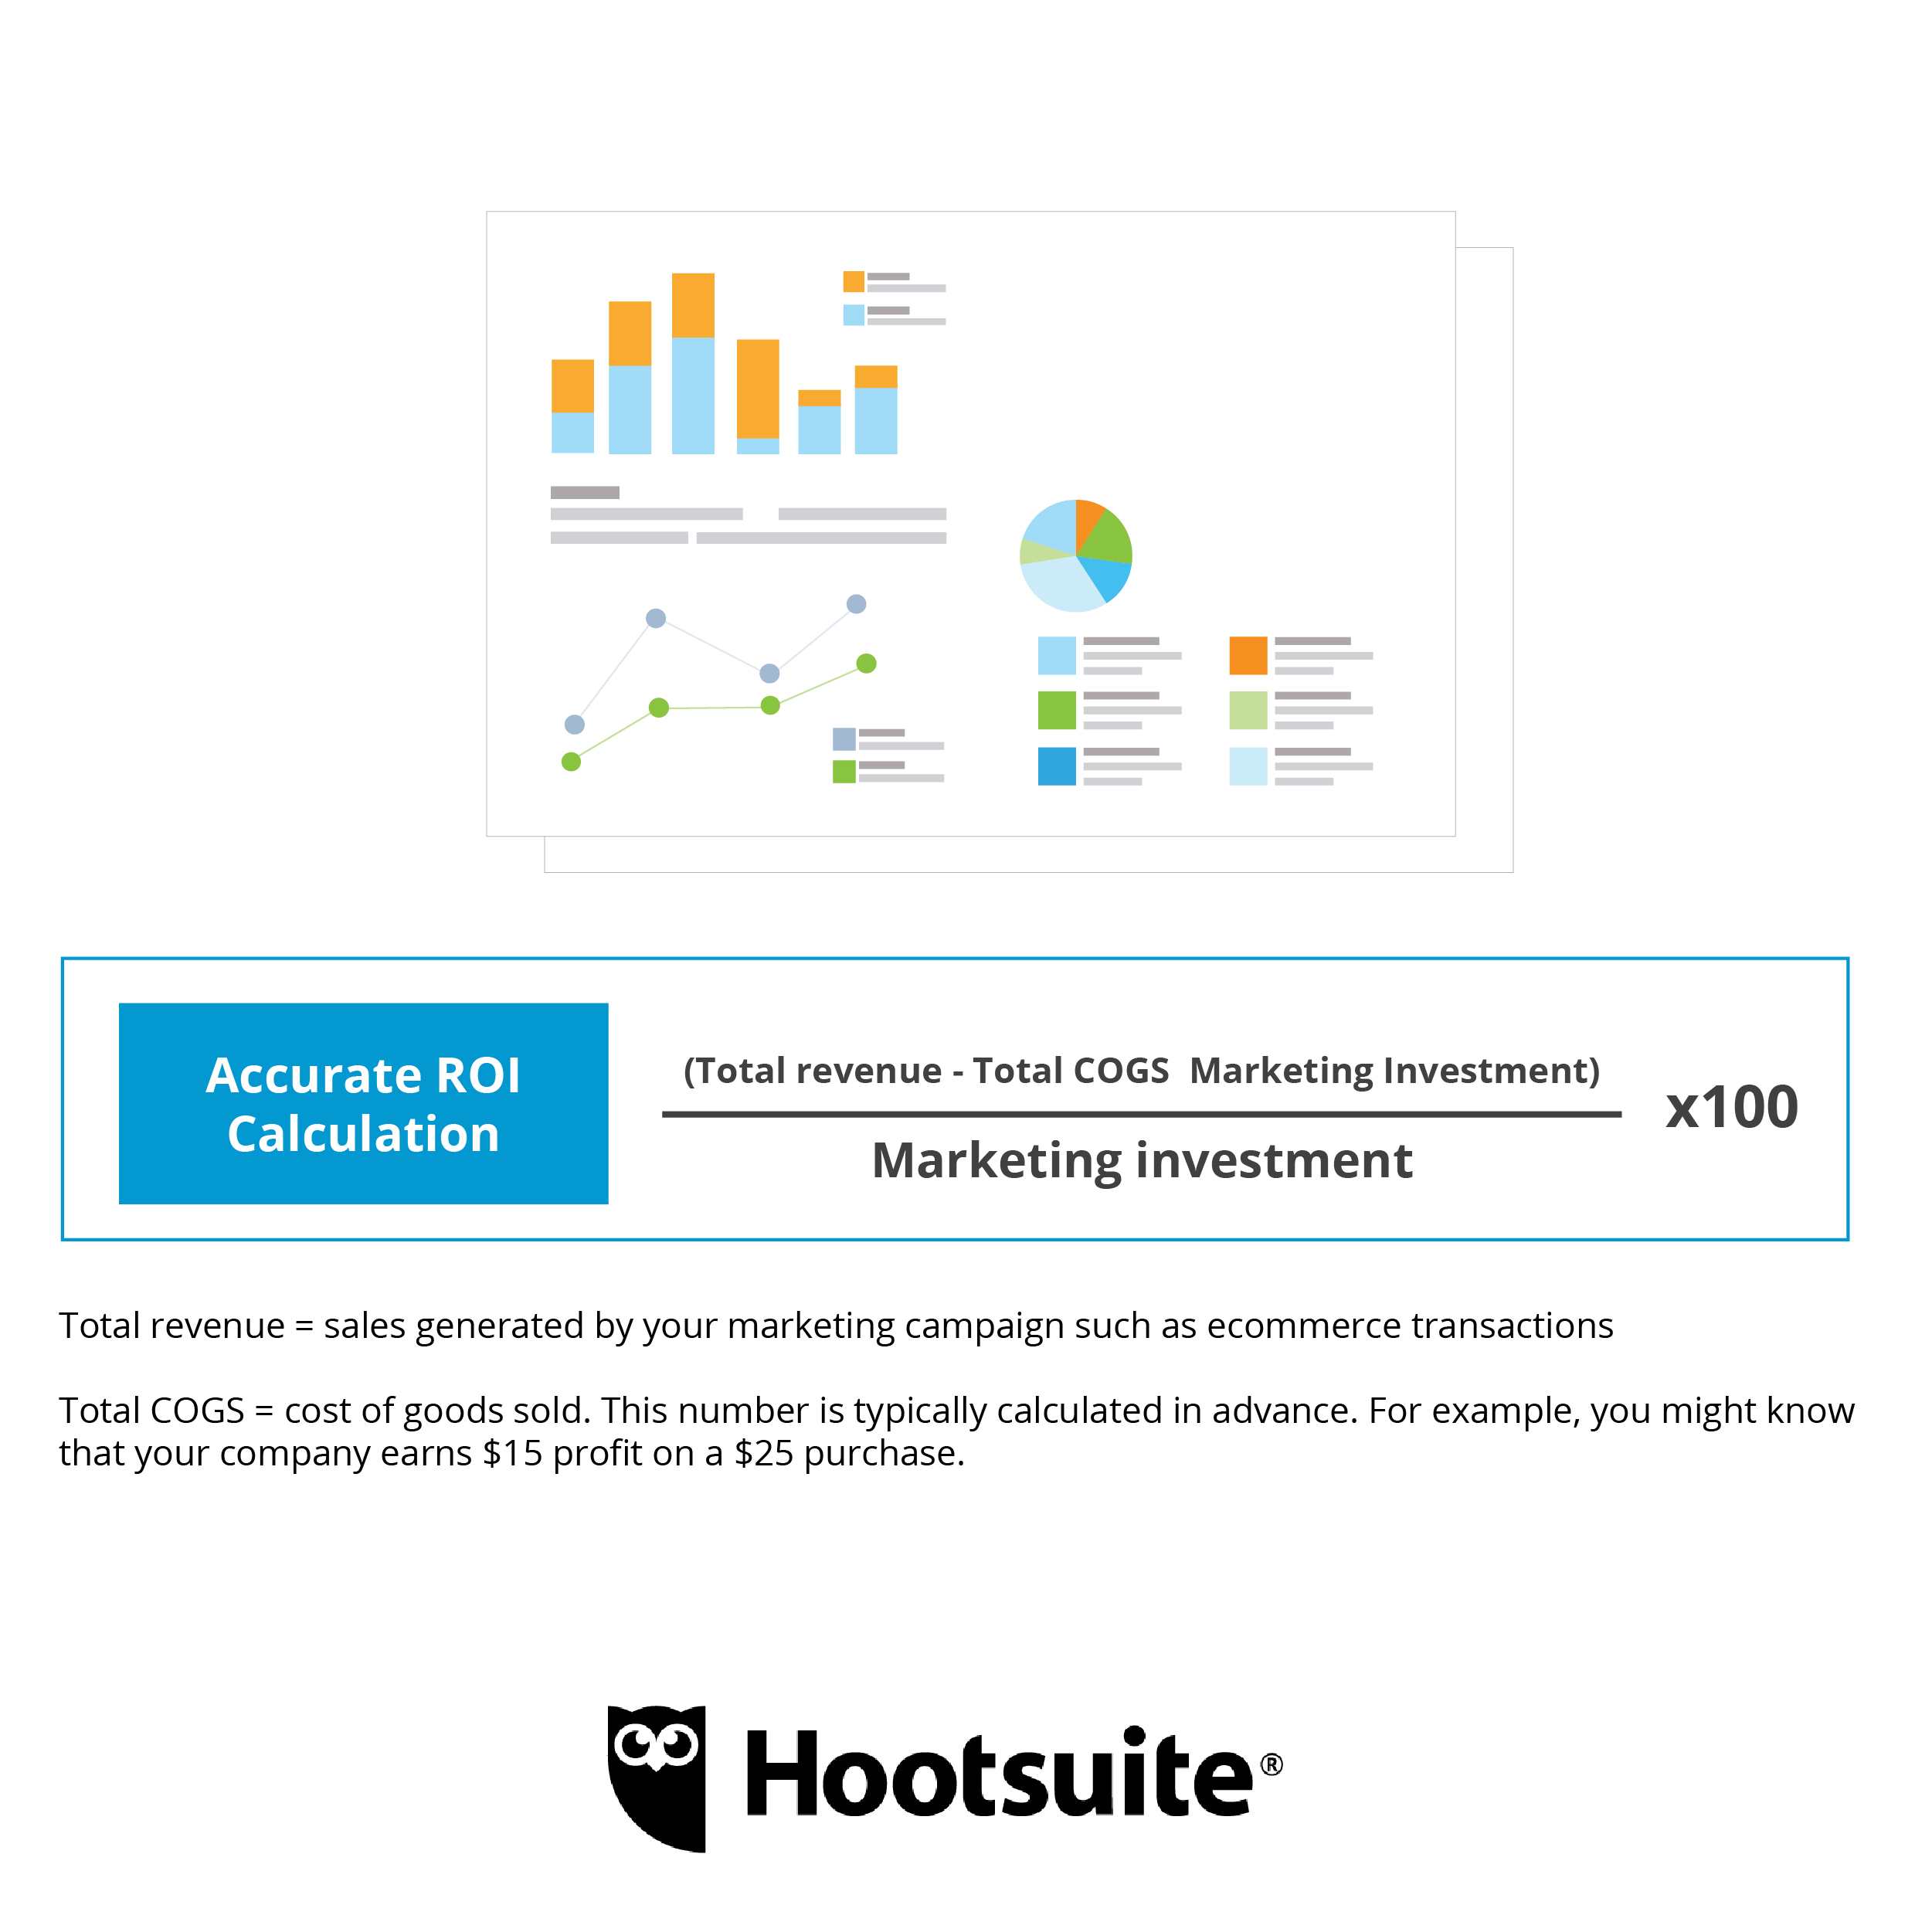 Click image to view and download larger file.
To accurately measure ROI you need to know a second calculation: the cost of goods sold. If you sell a $25 dollar product and only make $10 in profit on each unit you need to include that information in the ROI calculation.
First, go and calculate your cost of goods sold (COGS). This article shows you how to calculate your COGS.
Once you have your COGS calculation, add it to the ROI equation above. Let’s say in our example earlier, we talked to our finance department. They told us that for every $25 product we sell, we make $15 in profit. So our COGS would be $10 per unit sold.
We know that our COGS is $10 per unit. We sold 10 products in our Facebook ad campaign. So our COGS is $100.
So here are all the numbers we need to (finally) calculate our ROI. We spent $100 on Facebook ads. This is our marketing investment. We sold 10 products at $25 each. That brings our total revenue to $250. We know that our COGS is $10 per unit. We multiply 10 by 10, bringing our total COGS to $100.
Subtract our total revenue ($250) from our total COGS ($100) and our marketing investment ($100). The answer is $50. Divide $50 by our total marketing investment of $100. This gives us 0.5. Multiply by 100 to give us the percentage: 50. Our ROI is 50 percent, meaning that our Instagram ads are a worthy use of company time, resources, and money.
Still unsure how to calculate your ROI? Qlutch, a popular marketing resource, walks you through ROI calculations from start to finish in a short video. I’ve borrowed a lot of the tips above from Qlutch’s excellent resources.
2. How to calculate your year-over-year growth rate
 Click image to view and download larger file.
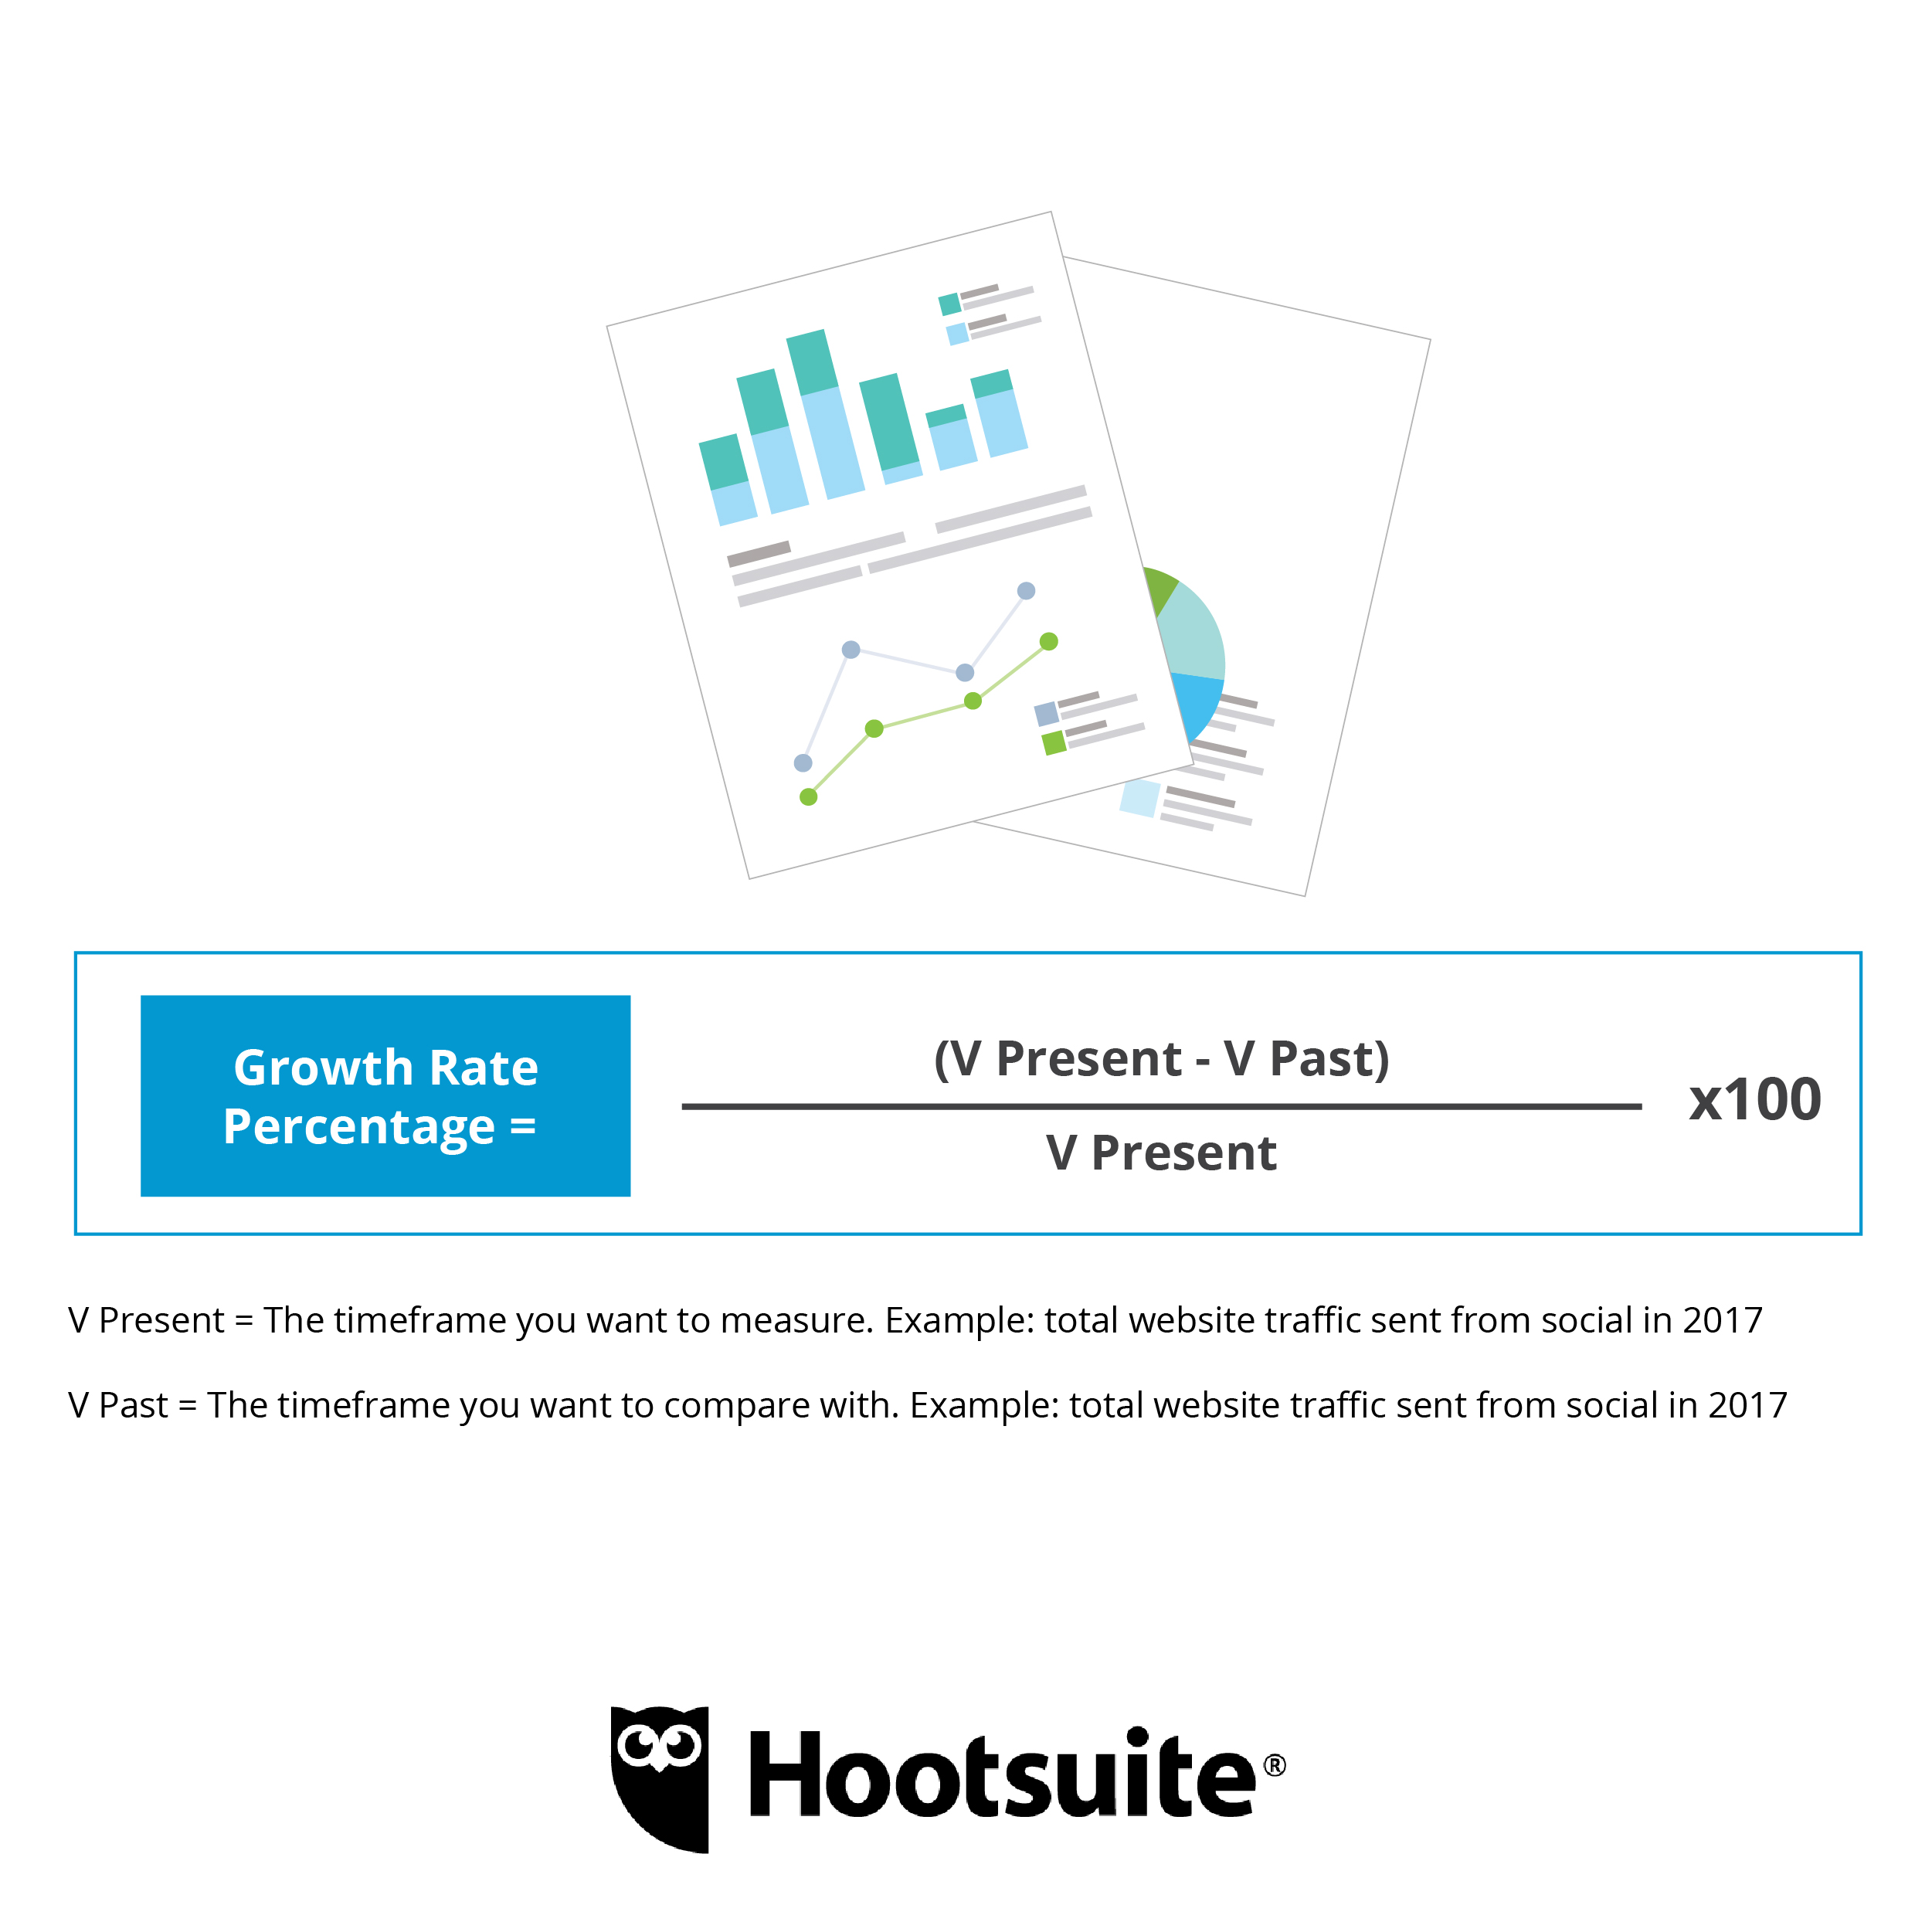
Our jobs as marketers is to drive growth and sales. And one of the best ways to demonstrate your results is with a year-over-year (YOY) comparison.
YOY is a common technique for accurately measuring growth as it helps to smooth over seasonality (such as a flood of sales for Black Friday) or misleading traffic spikes (such as a popular blog post last month making it look like your traffic is declining this month).
You don’t need to wait for January to use YOY calculations. You can compare months such as comparing a traffic drop in October 2017 to your total traffic in October 2016. Or you can analyze by different quarters, revealing an accurate view of the health of your business.
It’s a simple calculation. Pick a metric you want to report on, such as total yearly website visits from social media. Let’s say our 2017 yearly total was 100,000 visits and our 2016 yearly total was 90,000 visits.
Subtract 100,000 (current year) from 90,000 (previous year). The difference is 10,000.
Divide 10,000 by 100,000 (current year). The answer is .01
Multiply .01 by 100. The answer is 10.
Your growth rate for 2017 was 10 percent, increasing social traffic from 90,000 visits in 2016 to 100,000 in 2017.
90,000 from 100,000.
How to calculate this in Excel
You can use Google Analytics, Tableau, or Hootsuite Analytics to calculate your YOY growth rate for different metrics. Excel is also useful for creating dashboards and conducting deeper analyses.
Enter the formula below in Excel and you’ll see your YOY growth rate.
Open an Excel sheet and create three columns: A, B, and C.
In cell A1, enter the number “2016.” In cell A2, enter “2017.”
In the cell B1, put your 2016 total traffic, leads, or sales numbers. In B2, put your 2017 total traffic, leads, or sales numbers.
Go to cell C2 and type this formula in: =(B2-B1)/B1
You now have your YOY growth rate in Column C.
Share with your boss and enjoy your promotion.
3. How to calculate your (true) conversion rate
Marketers love to ask about different conversion rates. If your conversion rate is low, don’t worry. You’re probably just calculating it wrong.
The problem is that tools like Google Analytics or Optimizely will automatically calculate your conversion rate for you. This aggregate number generally ends up in reports.
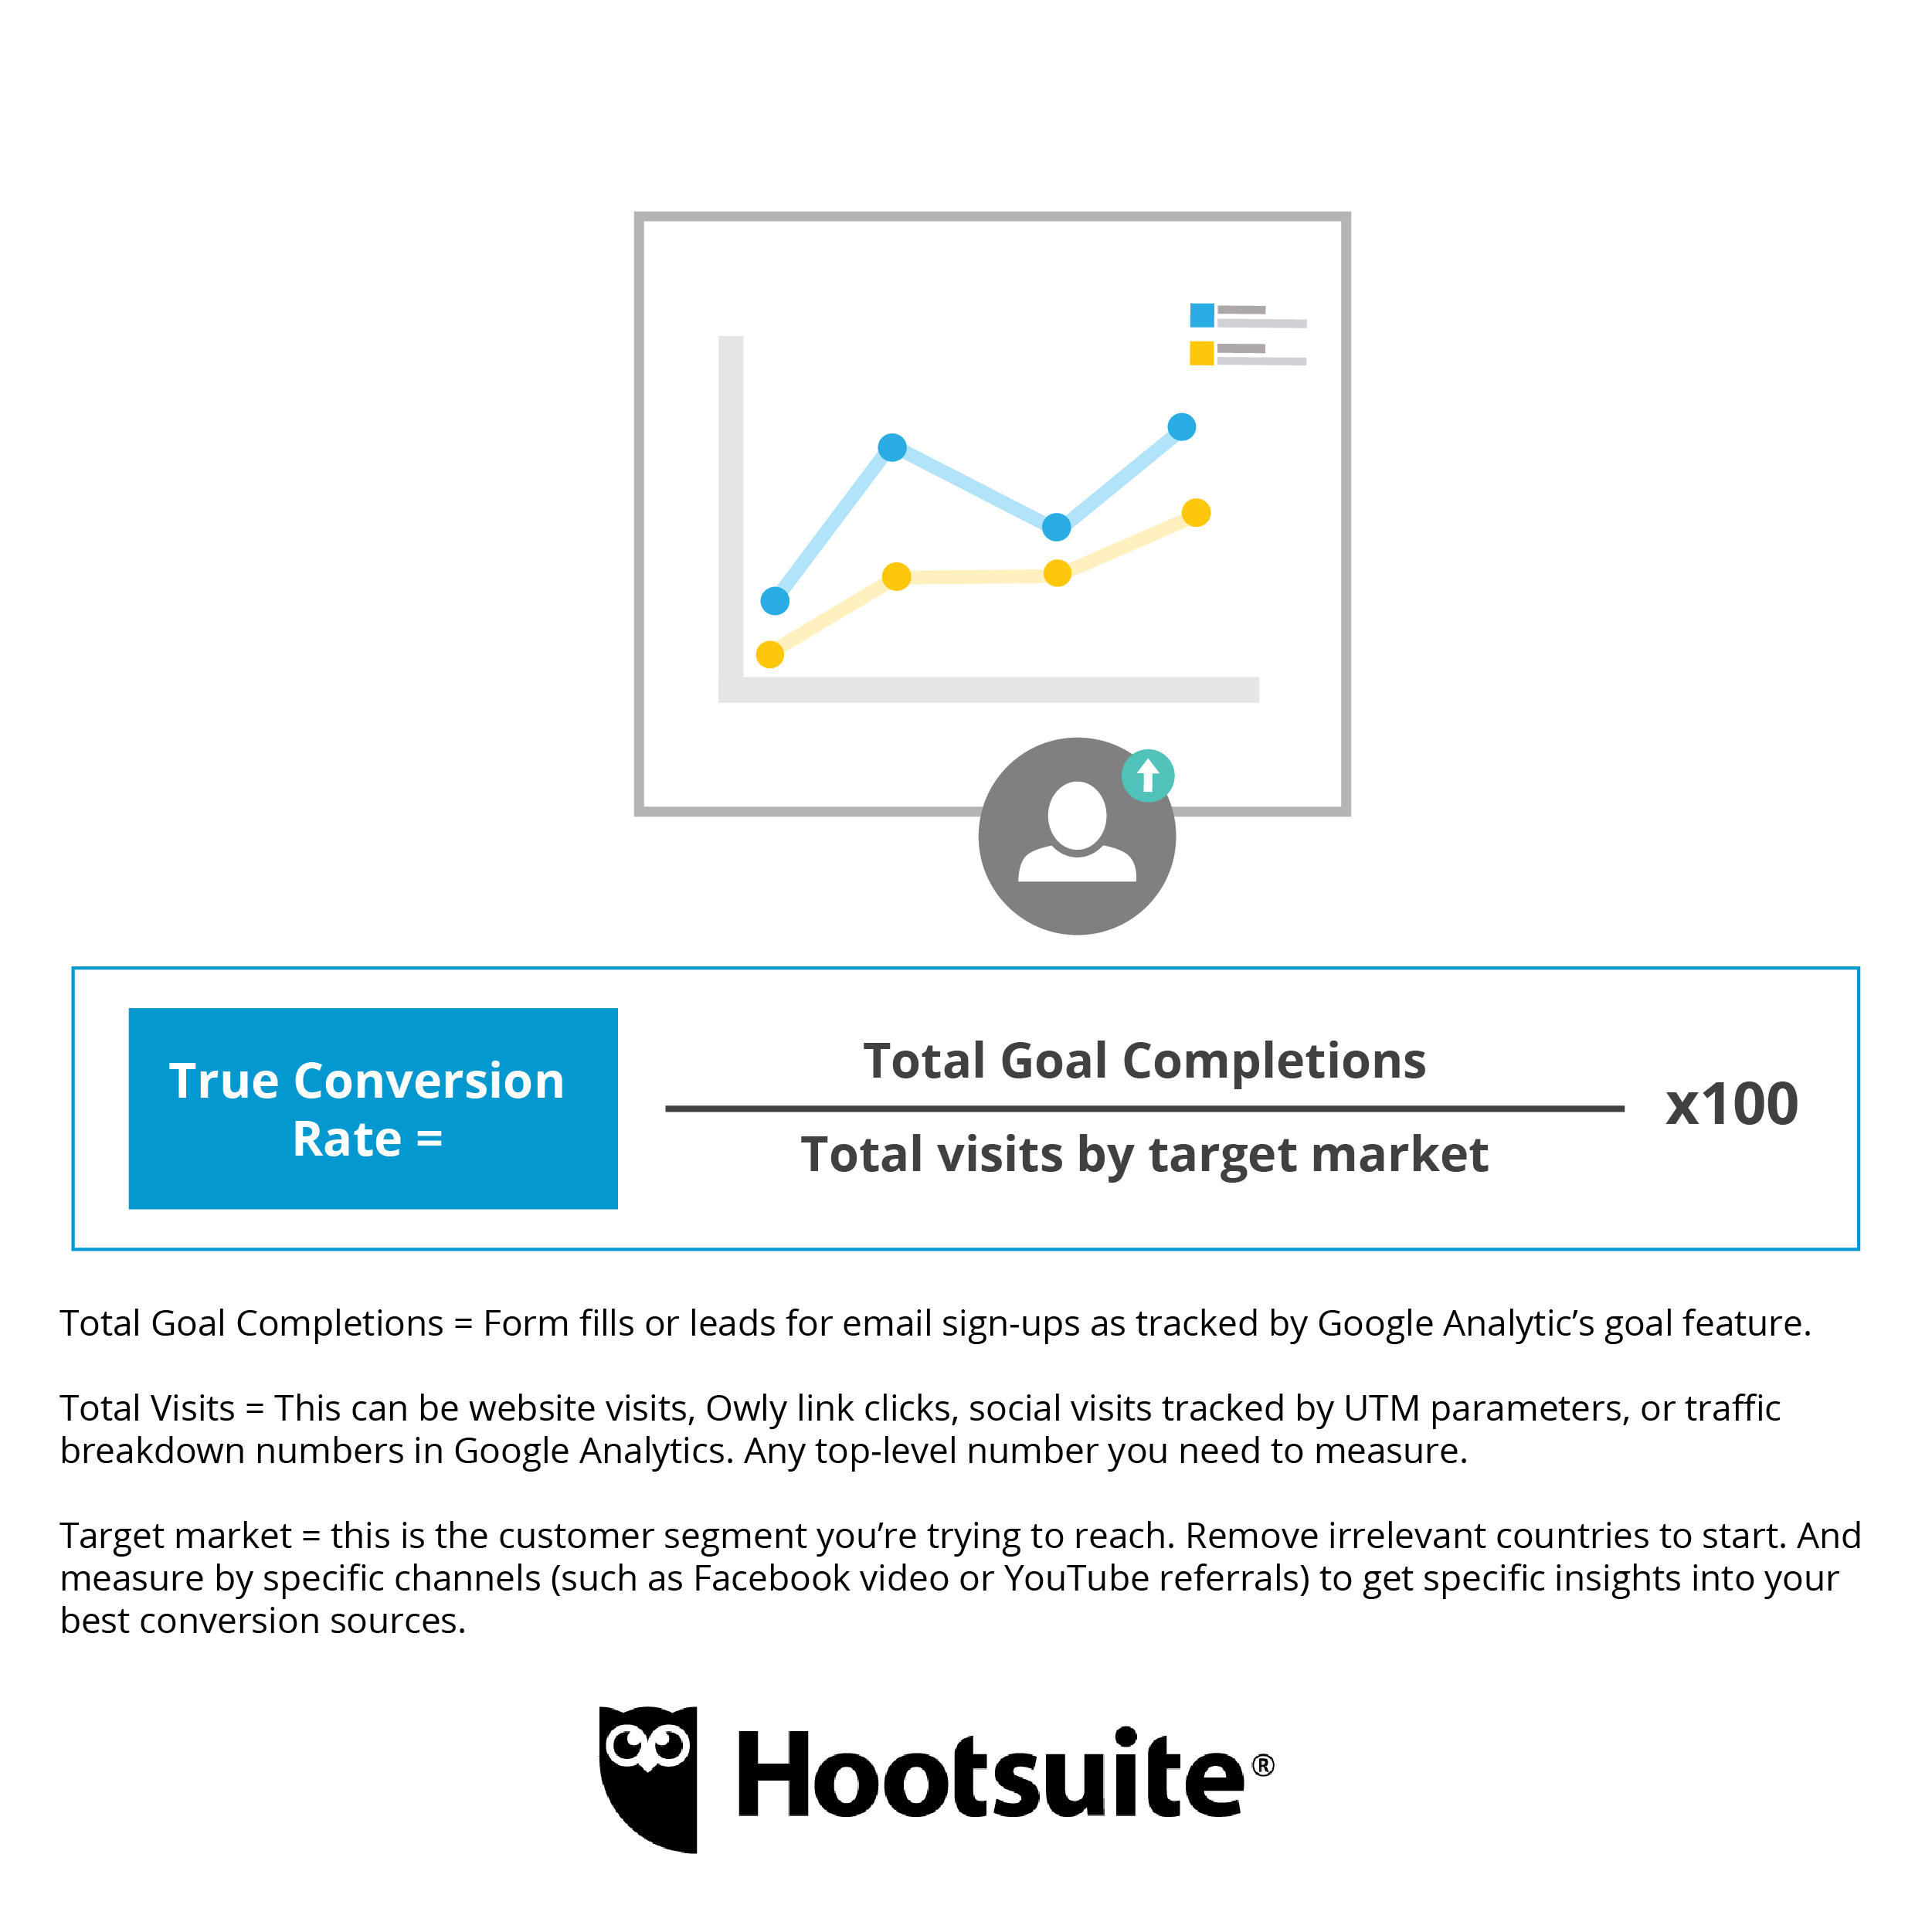
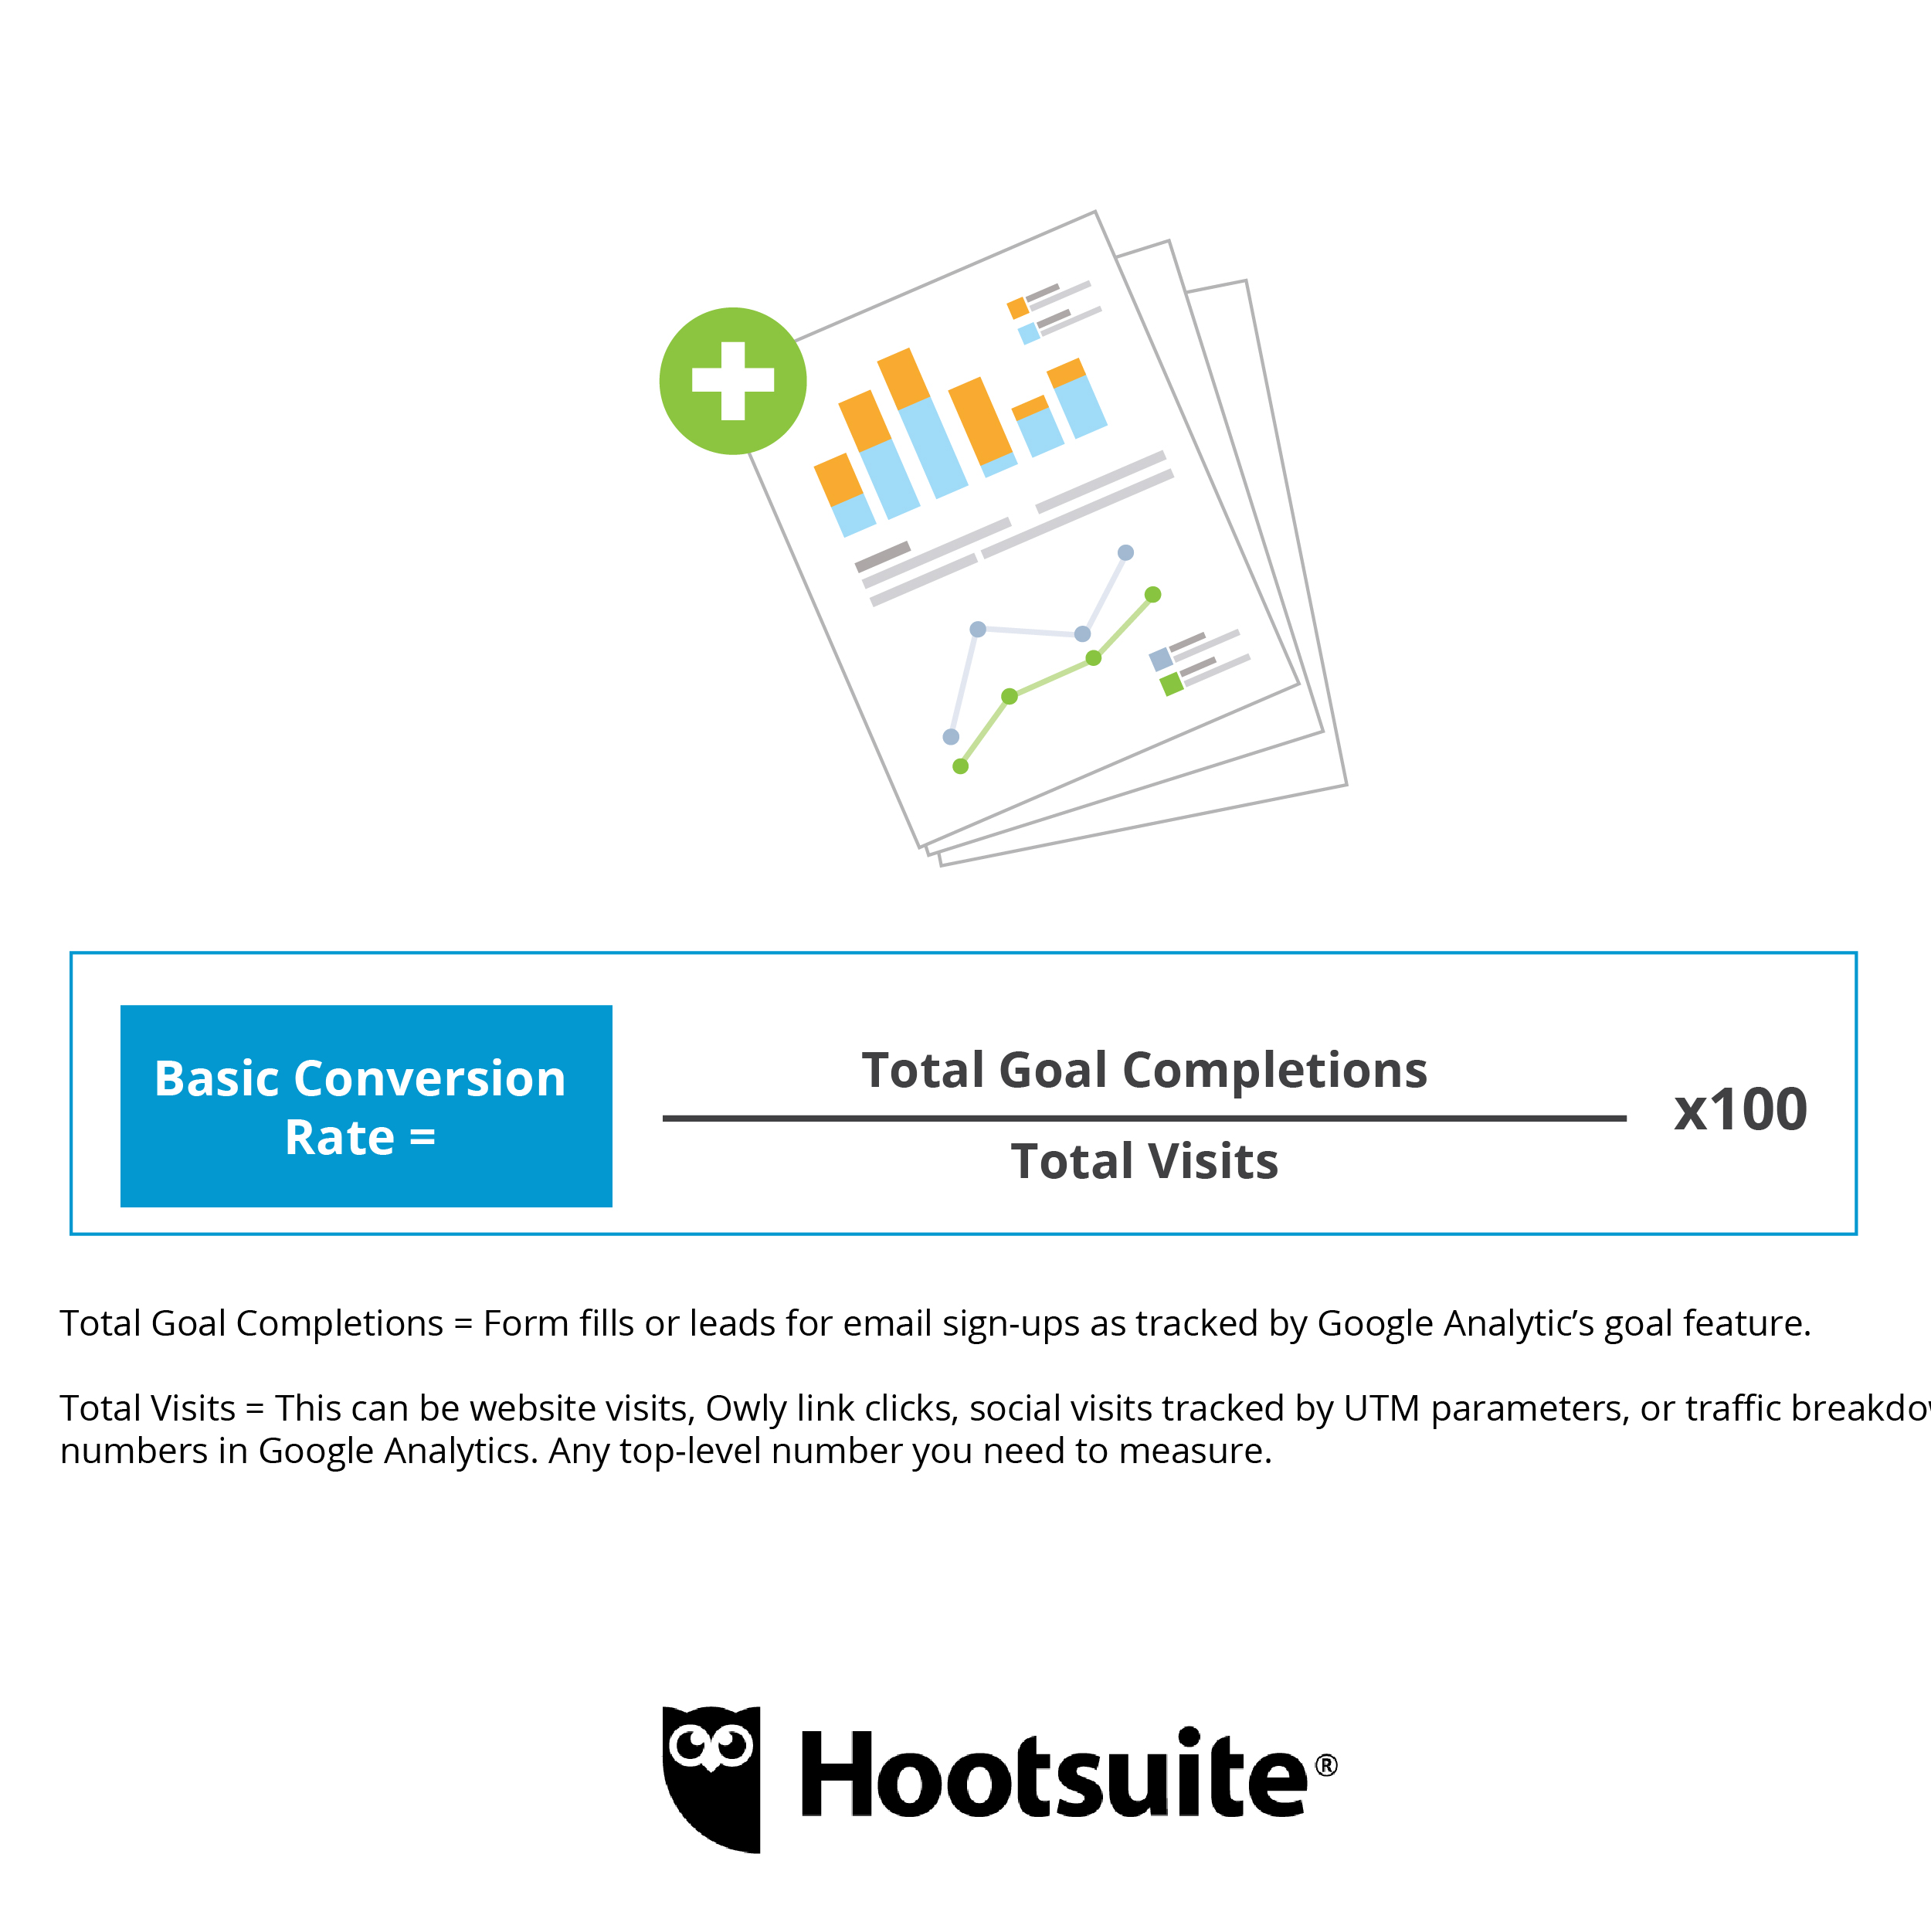 Click image to view and download larger file.
To calculate a basic conversion rate, follow these steps:
Divide the total goal completions in Google Analytics (such as leads, downloads, mobile app sign-ups, email subscribers, ecommerce purchases, or whatever else you value as a business) by the total visits (this can be social media traffic, general website traffic, or the total visits to your website).
Multiply the answer by 100 and you’ll get your conversion rate. Example: 10 (Goal Completions) divided by 1,000 website visits equals 0.01.
Then multiply 0.01 by 100. The answer is 1. Your conversion rate is 1 percent.
The issue here is that you are using an aggregate number—such as total visits to your website—rather than the market segments you actually sell to. This is why most conversion rates seem really low.
Himanshu Sharma, author of the book “Maths and Stats for Web Analytics and Conversion Optimization,” offers an excellent tip for calculating a more accurate conversion rate.
As he explains in a recent blog post, “Google Analytics will take every person on the planet into account when calculating your conversion rate metric.” This gives you aggregate data that isn’t useful (if your company only ships products to the U.K., why would you report on people from Egypt that didn’t buy?).
Sharma has an easy solution: “Create and apply a new advanced segment (named ‘Traffic from Target Market’) in your Google Analytics view or profile which only shows traffic from your target market.” Now, you’ll see much more relevant traffic data and your boss won’t be always asking you why only five percent of prospects convert.
 Click image to view and download larger file.
Follow the same steps as above. Only this time ensure that your total number of visits are only from your target market, using Google’s advanced segments to filter out irrelevant traffic sources.
4. How to calculate customer lifetime value (LTV)—simple formula
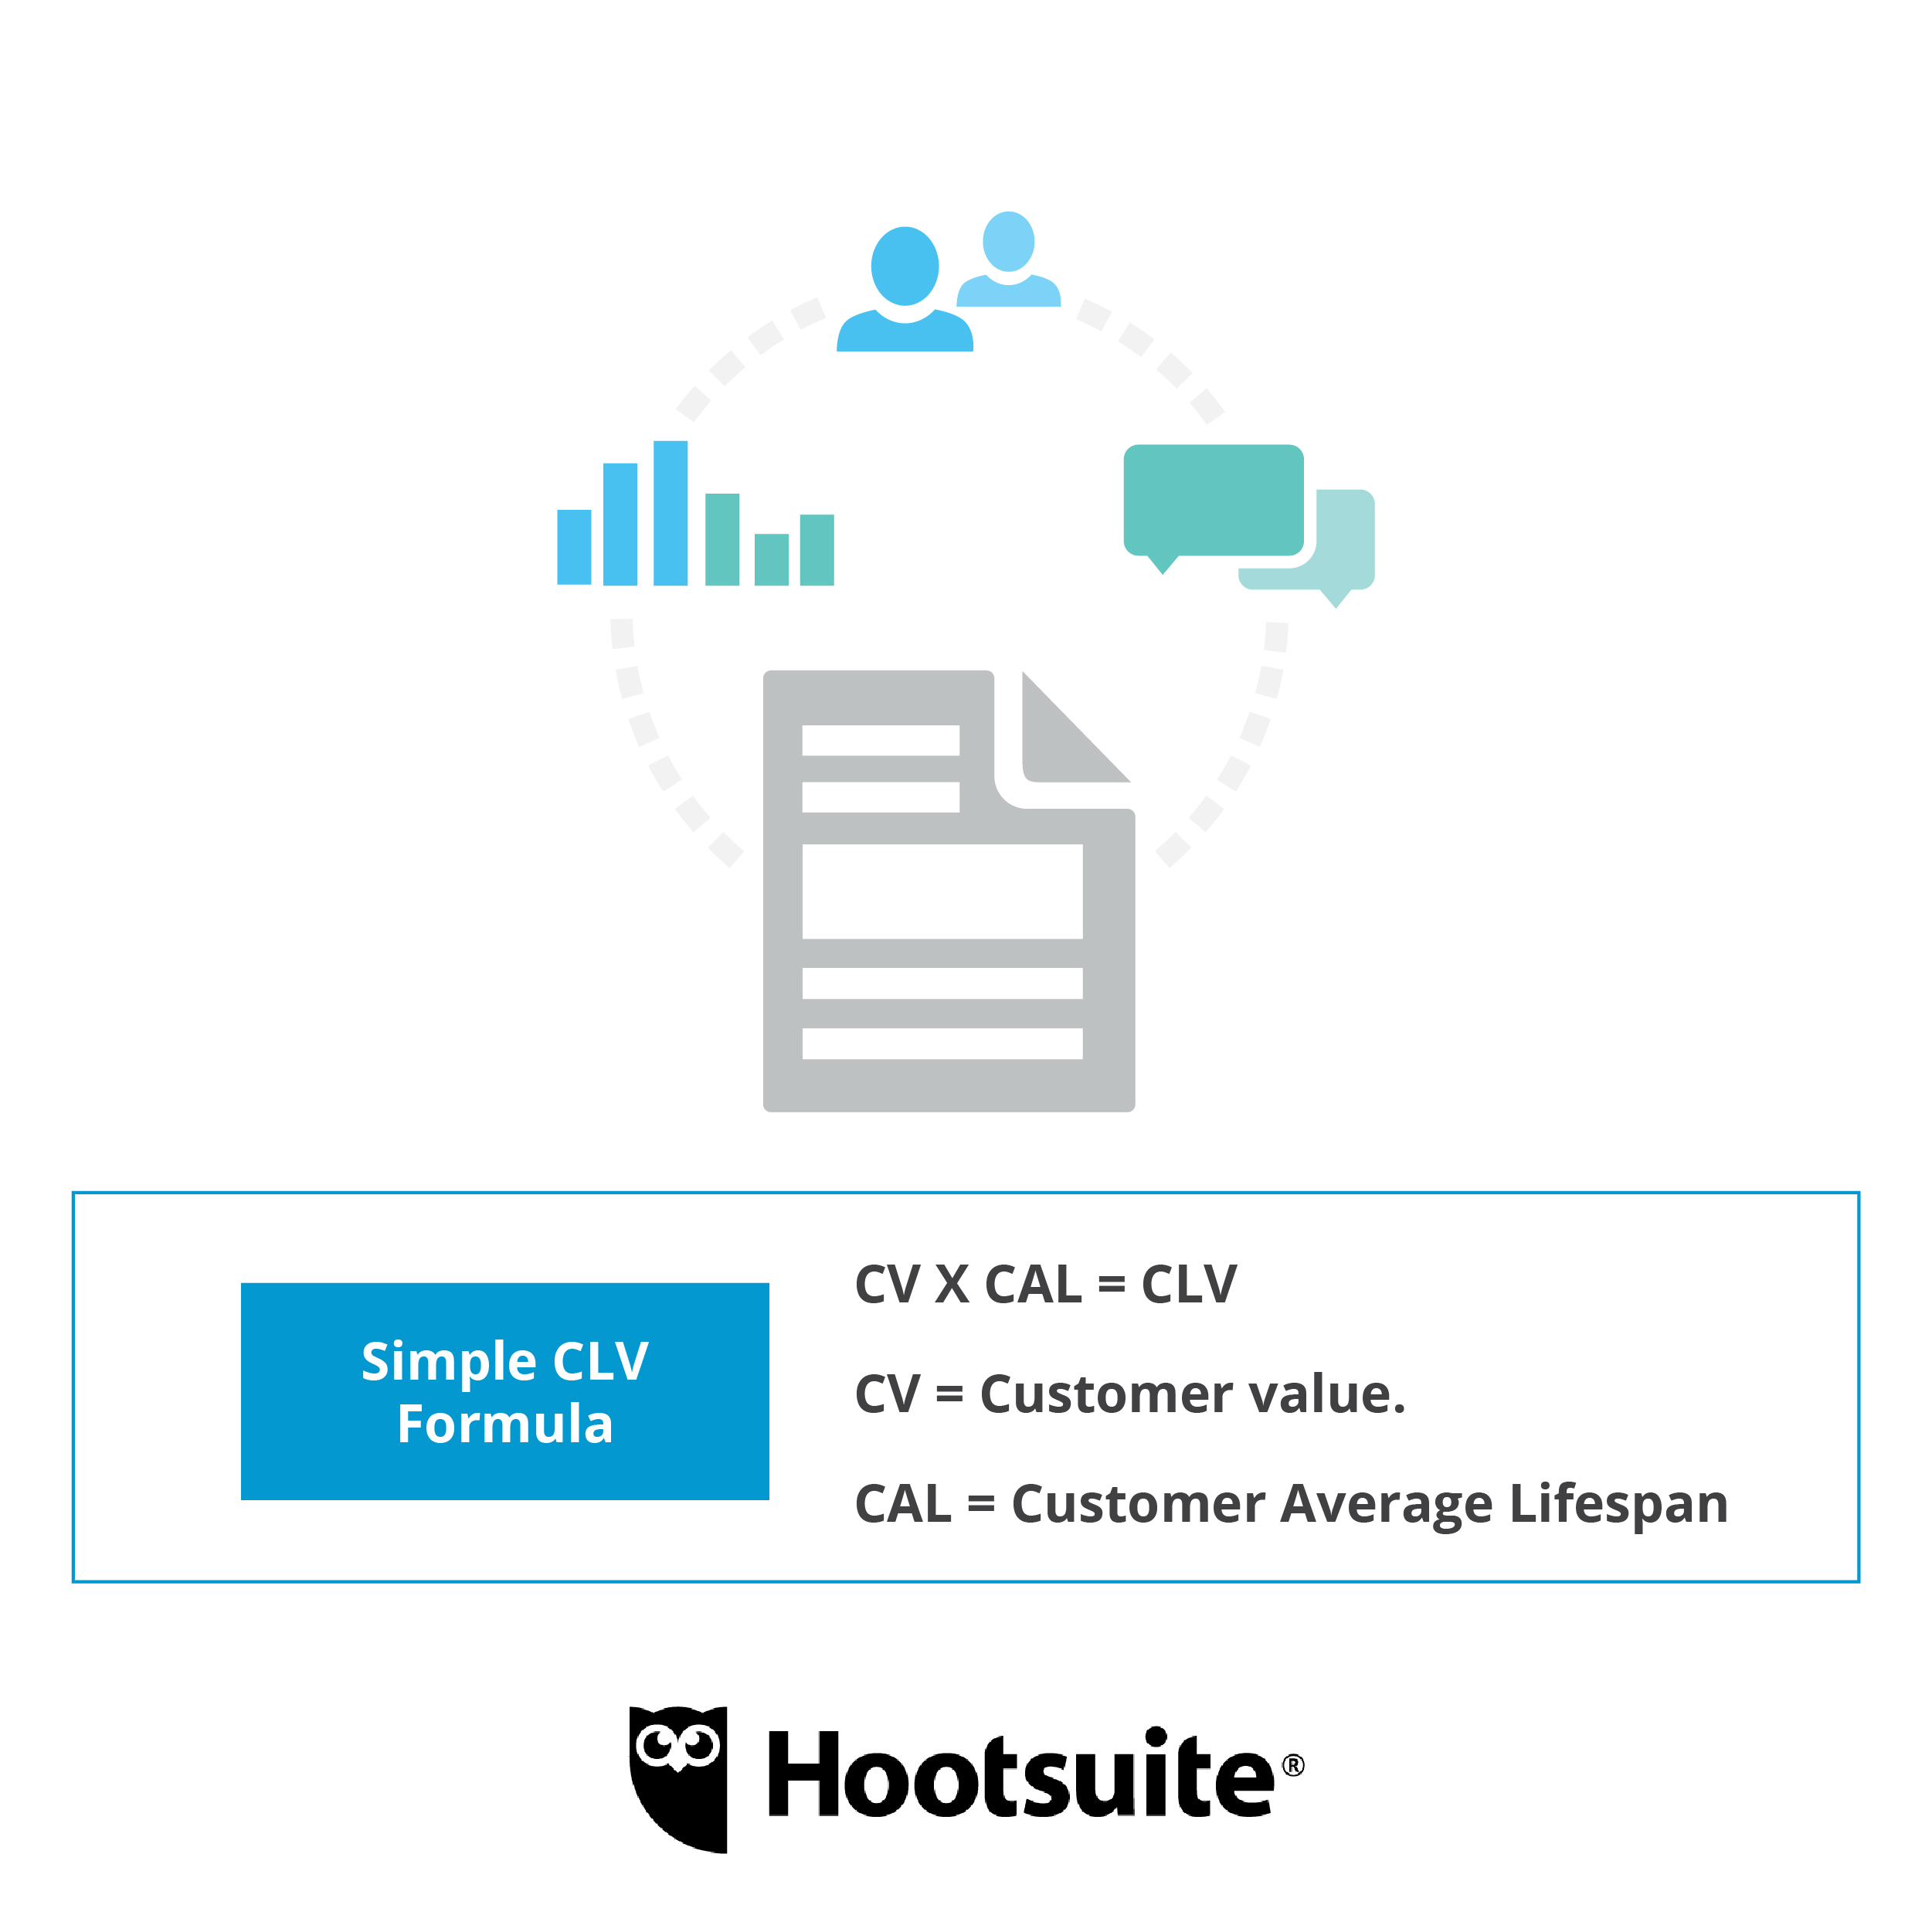 Click image to view and download larger file.
According to the ecommerce company Demac Media, “CLV [customer lifetime value] is a prediction of how valuable a customer is going to be to your business over a specific period of time”
To create accurate marketing plans, you need to know the lifetime value (LTV) of customers. In this post, I’ll show you a simple LTV calculation as well as include a few resources for future reading.
Consider a business such as Netflix. Their standard plan is $9.99. Let’s say the average user signs up and stays with them for two years before cancelling. Then, after a few promotional emails or after they announce a new season of a show like House of Cards, the average user signs back up and stays another 15 months.
This means that an average customer is worth $389.61 to Netflix. When running Facebook ads or offering discounts to win back customers, Netflix needs to keep this LTV figure in mind so that marketing costs of acquiring customers do not eat away all the profit that customer is likely to bring in.
A simple way to calculate LTV
Depending on your business, LTV can get quite complex to calculate. Today, I’m going to stick to a simple way to calculate LTV.
LTV requires us to have a bit of data, answering four key questions. Once we answer these four questions, calculating LTV is pretty simple. I’ve pulled these from a smart post by the team at Pixel Union (they have some fantastic resources for ecommerce stores and great website themes).
As Pixel Union explains, you’ll need the following metrics to calculate LTV. Let’s meet the metrics. And I’ll show you how to gather this data.
Average Order Value (AOV)—How much does the average customer spend in one visit? For a coffee shop, this might be how many lattes and muffins the average customer buys. For a hotel, it’s how many nights and mini-bar purchases the average patron buys. For an online retailer, it’s the average shopping cart amount.
The best way to gather the data for AOV is to work with your finance team or accountant. Every business files taxes, so your accountant will know the total sales revenue you reported last year. Next, speak to your analyst team and get the total number of orders for the last year. Divide your total revenue by your total number of orders. This gives you the AOV. If you don’t have an accounting team, you can just download all sales revenue from PayPal or Stripe or whatever you use and then download total sales orders from your shopping cart or payment system.
Purchase Frequency (PF)—How often do customers purchase from you? Every week (for example, a coffee shop)? Every month (for example, a software business)? Every few years (for example, a vacation rental or luxury retail company)? A few times in their lifetime (for example, a mortgage broker or a luxury car brand)?
There are a few ways you can gather this data. A sophisticated business will track this data somewhere. A smaller business can simply do a simple research study. For example, a coffee shop could use a loyalty card to track repeat customers. Or you can ask your analyst team to help. All they need to do is divide the total number of orders by the number of unique customers. This gives your purchase frequency. For example, you could download all transactions from PayPal and analyze these in a spreadsheet.
Customer Value (CV)—This is average value of a customer. This is how much money we can reasonably expect to extract from our customer’s wallets.
To calculate, you’ll use numbers from AOV and PF. Multiply your AOV number (see above) by your PF number. The answer will be your average customer value.
Customer’s Average Lifespan (CAL)—How long will a customer stay a customer? A brand like Honda tries to make you a customer for life (buy a Civic in college, buy a minivan when the children come, and drive off into a sensible sunset in your tricked-out Accord). This varies from business to business.
Tying it all together
OK, you’ve gathered all the data for the metrics below.
AOV – Average Order Value
PF – Purchase Frequency
CV – Customer Value
CAL – Customer’s Average Lifespan
CLV – Customer Lifetime Value
To calculate your LTV, just complete the formula below:
Click image to view and download larger file.Multiply your CV number by your CAL number. Hit enter on the calculator. Boom! Pat yourself on the back because now you know the average CLV of your customers.
This will be an excellent start to making smarter marketing decisions. You can add more fancy math with the LTV resources below.
Get more advanced with LTV calculations
“But JAAAAMES,” I’m sure you’re asking. “What about including marginal profit, segmentation, overhead, and discount rate into our LTV calculations?”
For the math masters, I recommend this excellent post by Pixel Union, which I’ve borrowed heavily from above. Also, Demac Media published a wonderfully instructive book called, “Everything You Need to Know About LTV.”
For SaaS and online businesses, this guide will light the way to more profitable customer calculations.
LTV can be tricky to measure. This resource gives you a step-by-step overview of how to calculate LTV.
No comments:
Post a Comment